Opioid pill flood: How The Washington Post presents the American drug crisis
The drug overdose epidemic in the United States is no secret. But how high are the numbers? And where are opioid pills really coming from? The Washington Post’s new article, “How deeply did prescription opioid pills flood your county? See here” addresses those questions, and more, through engaging visualizations.
Steven Rich, the database editor for the investigations unit at The Post, and his team delved into a U.S. Drug Enforcement Administration database that tracks every single pain pill sold through 2019. They consolidated the data and visualized it to help readers better understand the scope of the opioid crisis.
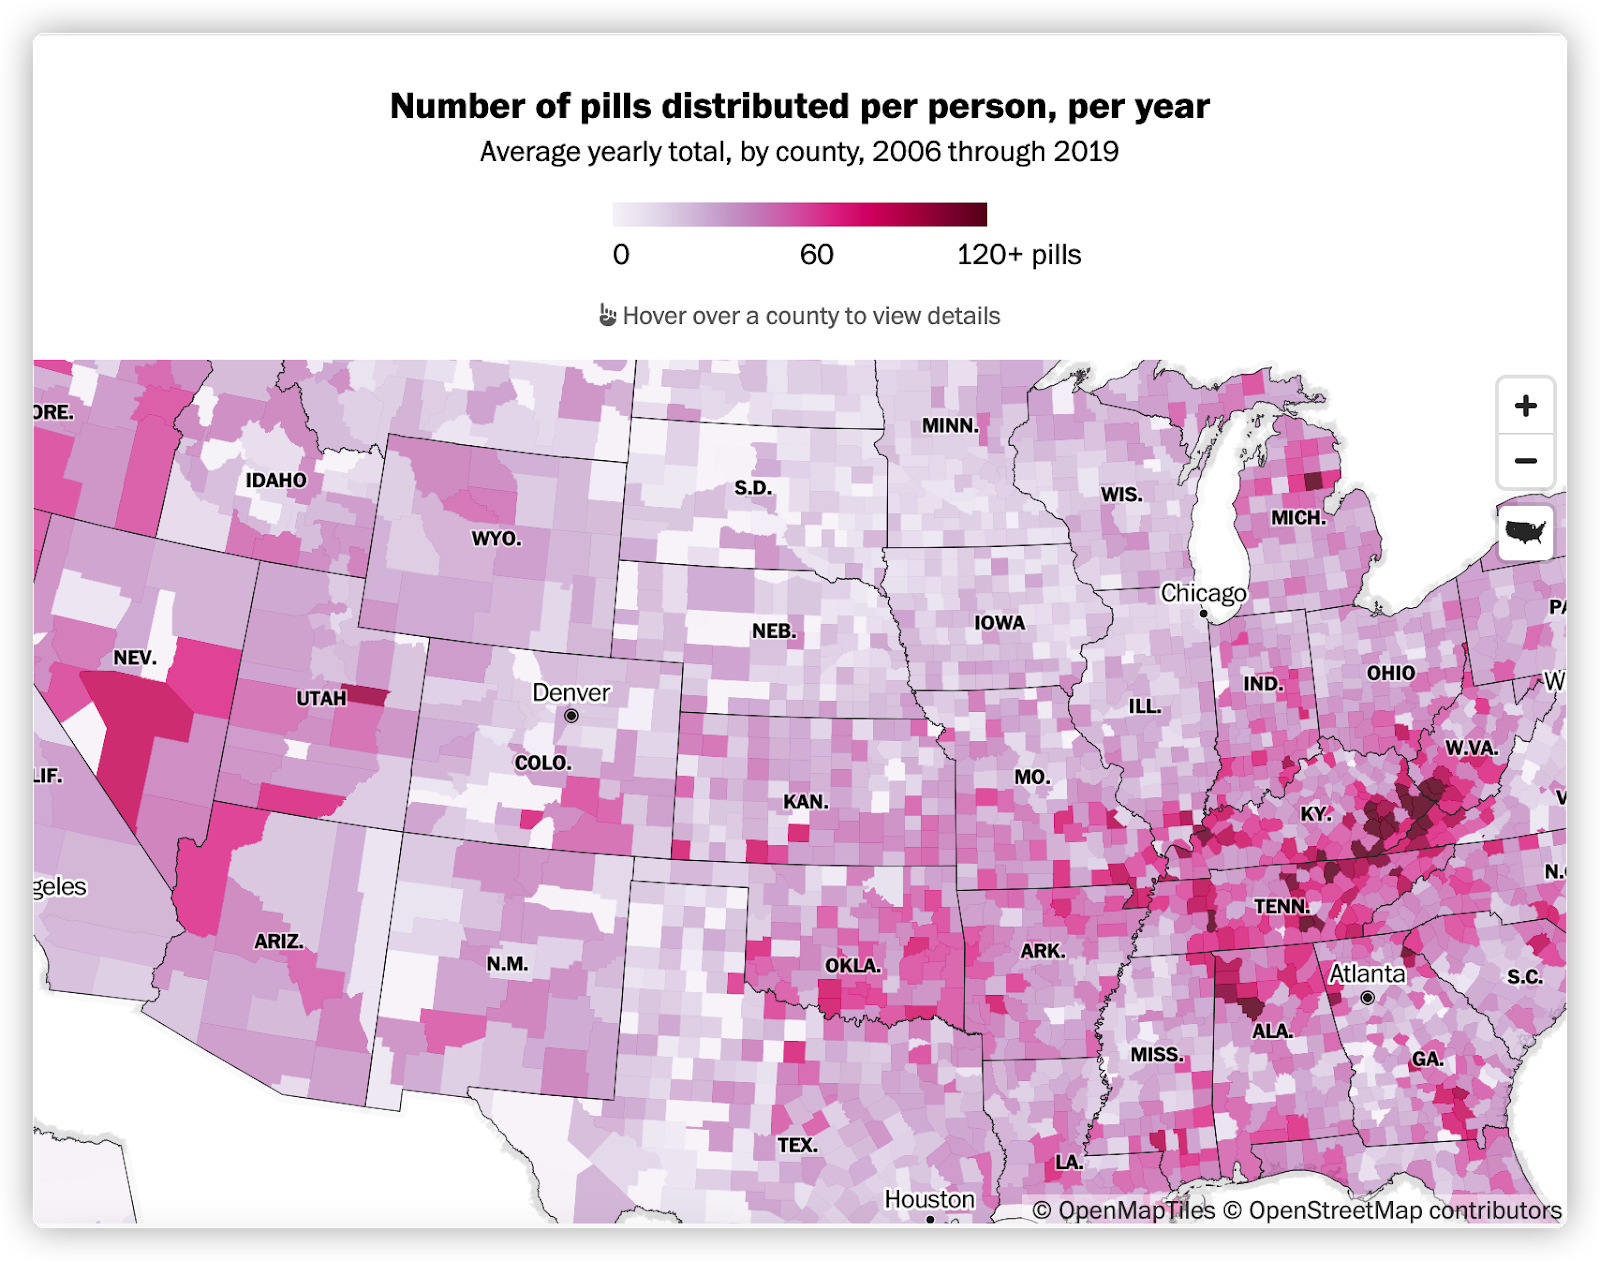
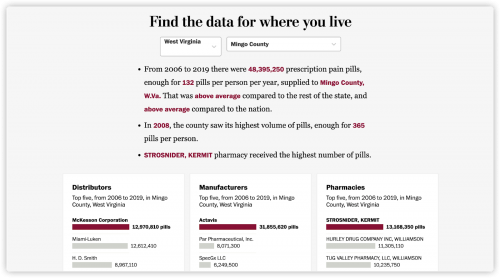
Their county-level map shows the average number of pills distributed per person in every county. Rich and his team also published the raw data from 2006 to 2019 for public use. They believe there are hundreds of stories within the data set.
Storybench spoke to Rich about the challenges he and his team faced in the process of their investigation.
The following interview has been edited for clarity and length.
Why do you think data visualizations are important in drug reporting?
Rich: I think it helps readers understand what is otherwise a very dense topic. I can throw numbers at you all day, and I can talk about oxycodone, hydrocodone and all of these kinds of drugs. But it’s going to make people’s eyes glaze over and they’re not going to actually understand what I’m talking about. I tend to think that people can understand the drug crisis better through data because we’re giving context.
What was your investigative process?
The project started eight years ago. In 2016, we started investigating prescription pills and opioid companies and it just started to go from there. At that time, we filed an open records request with the DEA to get data on prescription pain pills because we had had sources telling us that this was potentially interesting data. But we were denied the records and so we just kept going and reporting other things. We have dived into fentanyl, heroin and all the phases of the crisis.
Several years back, this very large civil case was hitting the courts. We had heard that they had requested this data through discovery that we had been asking for from the DEA.
Instead of going through the DEA to try to get it again, we intervened in the case –– along with HD Media, who owns a couple of newspapers in West Virginia –– to try to free this data to make it public. We have collected 14 years of data. We successfully obtained data for the initial seven years and then extended it for an additional two years. And then just this month, they were able to obtain five more years of data through the same case.

Do you have any suggestions for journalists who are facing the same difficulties?
Sometimes it’s hard. I’m not going to sit here and tell journalists that you’re going to get every database that you want. I’m still fighting for some that I have been trying to get since I started here 10 years ago. But I think persistence is key. I think journalists have to try all paths and be creative about it.
One of my favorite tips to people is usually to go through LinkedIn to find employees of companies that might have data that you want and also reach out to the former employees of those companies.
Why did your team decide to publish the raw data?
There are a lot of reasons why we decided to do it but the biggest is because we think that this data is important and we believe that we’re not the arbiters of every truth in the data. We want people to be able to use it for their own needs.
Another reason we did that is because the dataset itself is [composed of] 760 million records, which is not openable in [Microsoft] Excel. We wanted journalists in those communities, or researchers or just regular citizens in those communities, to be able to use the data to tell their own stories.
What data analysis tool has your team used considering the file is that large?
Our method of doing that involves taking a large CSV file and cutting it into million record chunks, turning those millions of chunks into parquet files and then running the analysis in parallel. I write code using Python, using a library called Desk. It’s basically a parallel version of pandas. And then I’m able to run queries against the 760 million records in under a minute, which is incredibly efficient for a dataset that size and for visualization.

- 35+ data visualization tools that The Washington Post uses - April 16, 2024
- Kontinentalist shows the legal battle for women’s divorce rights in the Philippines with visual and data storytelling - February 27, 2024
- Reuters: Journalism and technology trends and predictions - February 15, 2024


