Step by step: Exploring the sneaker lifecycle through data physicalization
Laces. Sole. Heeltab. Toebox.
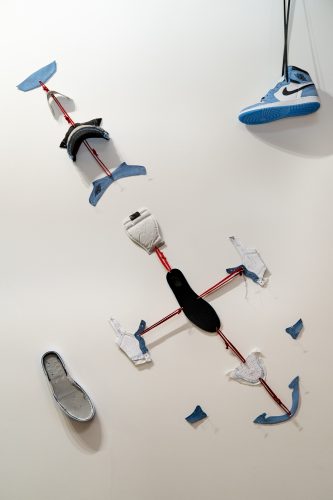
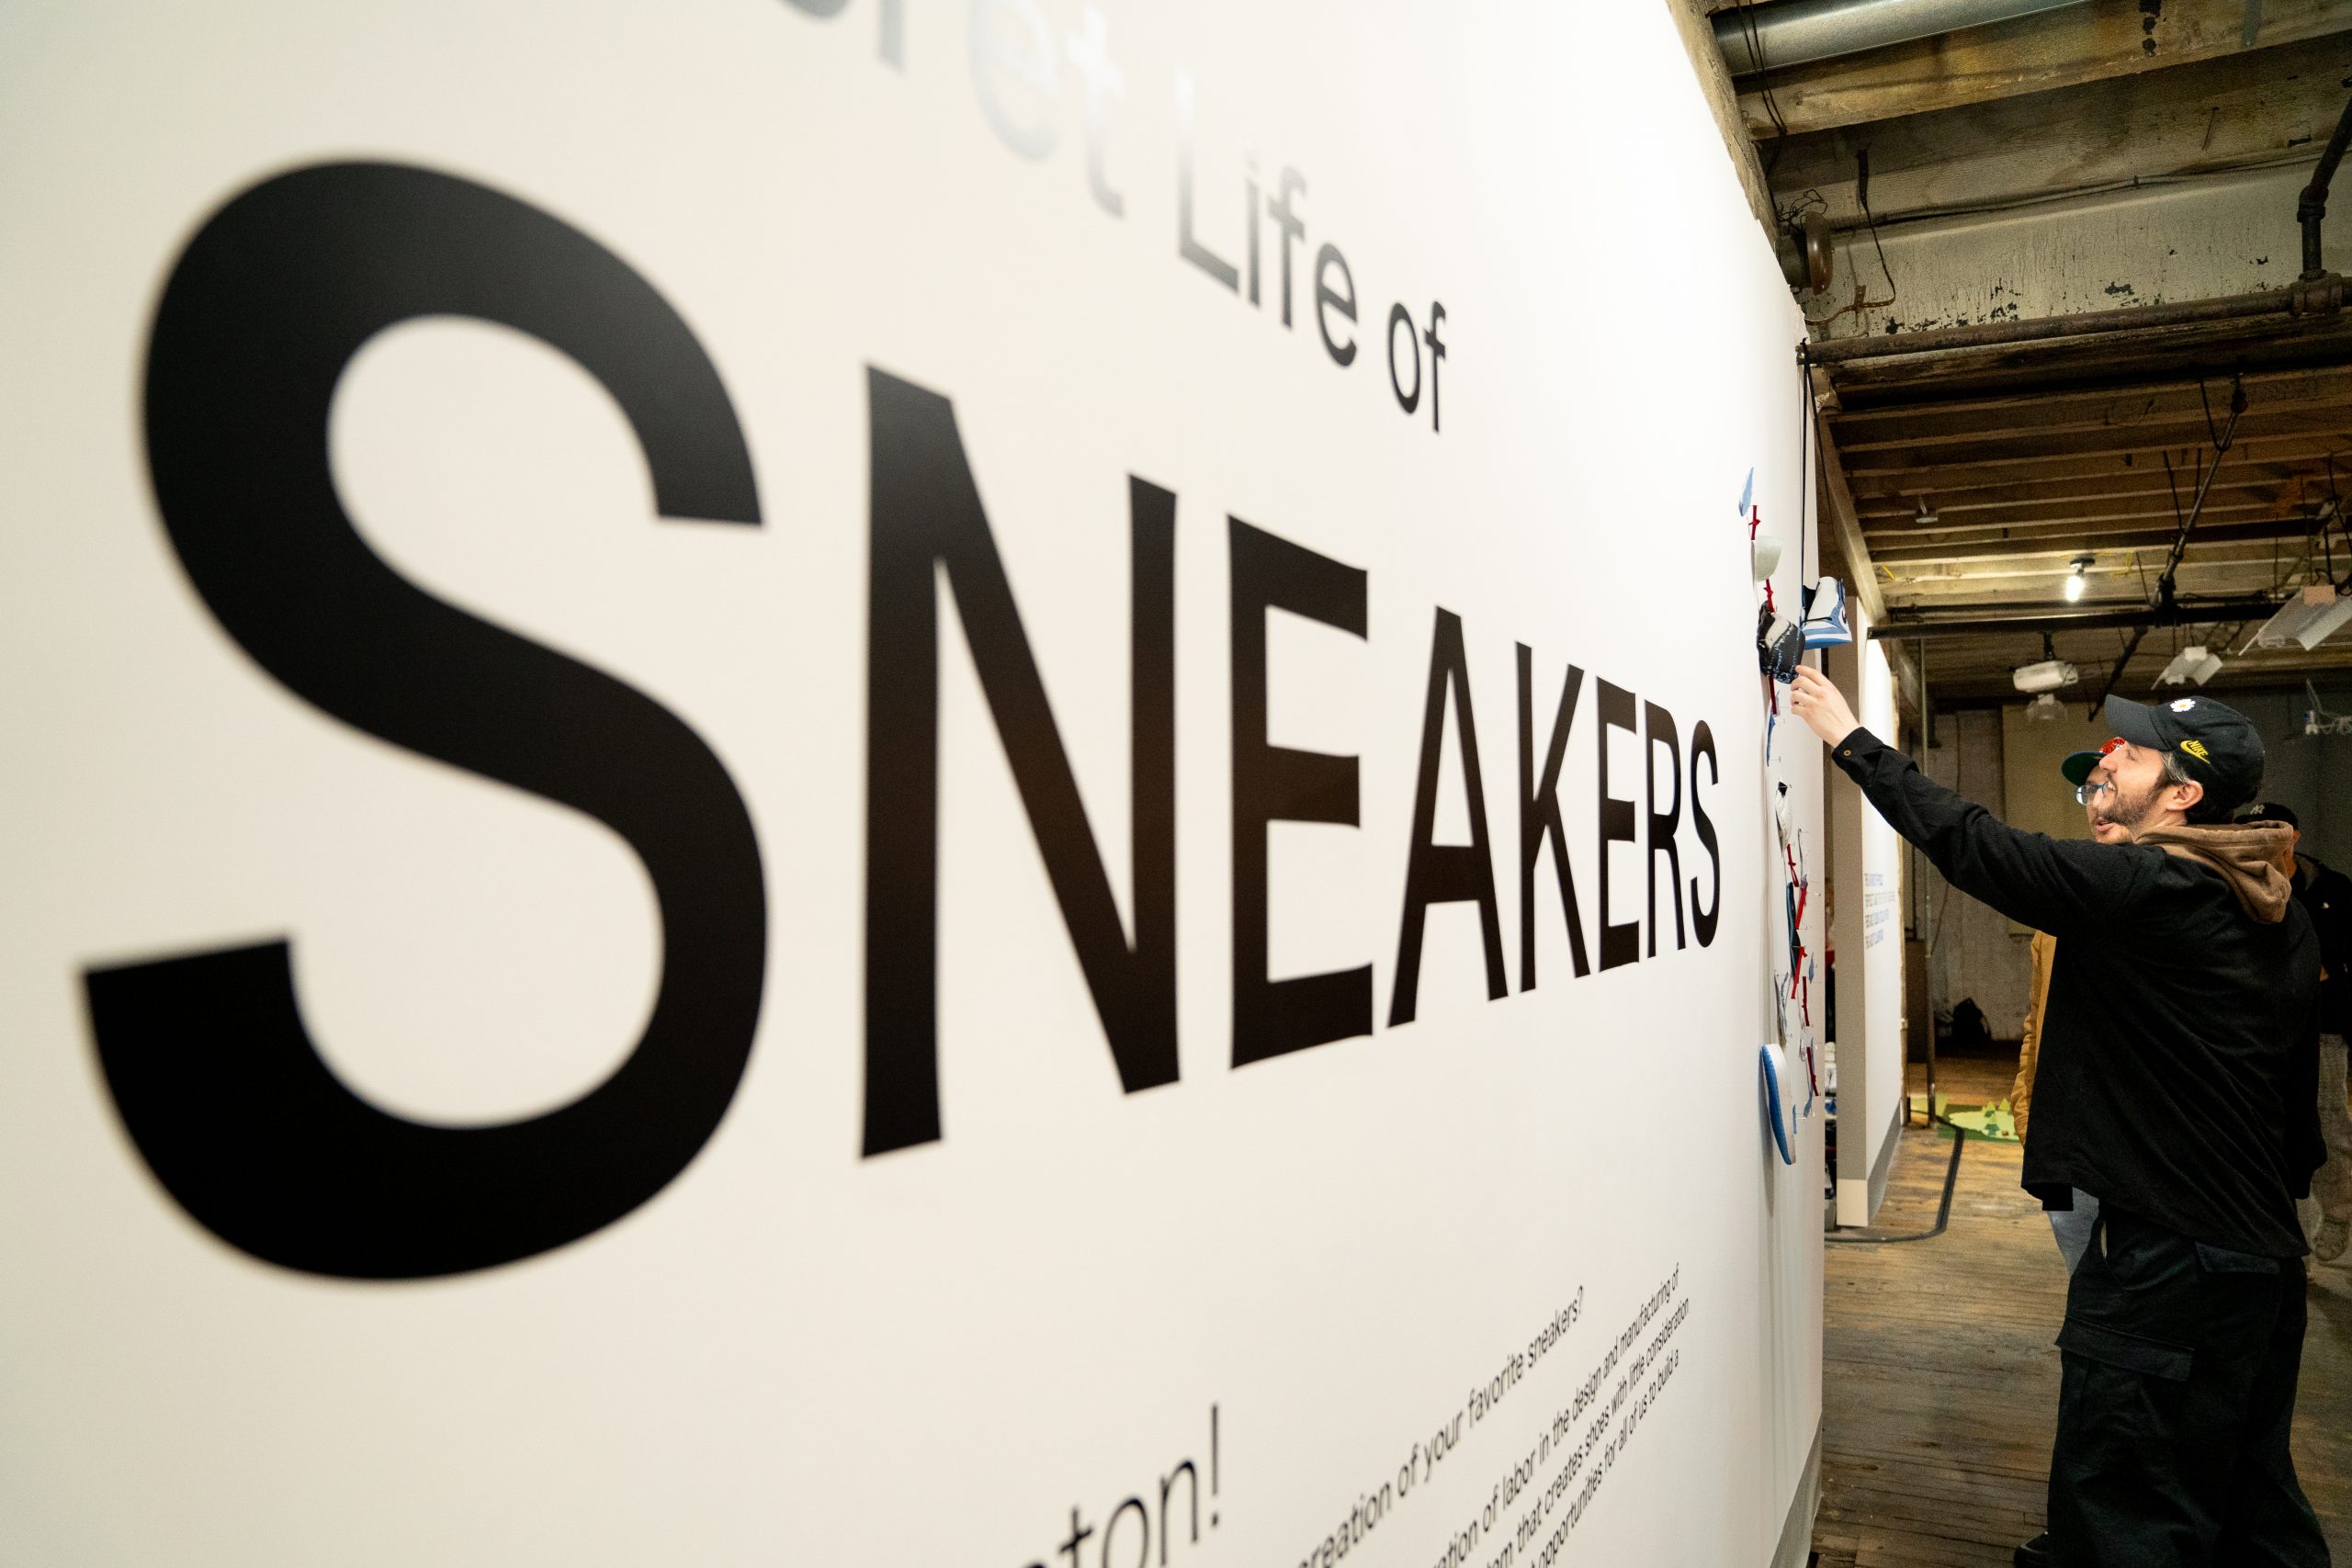
An exploded axonometric model of a single blue Nike Air Jordan sat at the entrance of “The Secret Life of Sneakers,” revealing individual components of the shoe’s structure. Walking past it, viewers entered a data physicalization exhibit aimed at raising awareness for more sustainable practices in the sneaker life cycle.

The installation, which opened on Friday, Feb. 2, was created by XYZ Data Labs at Northeastern University in partnership with The Footwear Collective. It was held at 212 Gallery in Chelsea, Massachusetts — coincidentally, once home to a shoe factory.
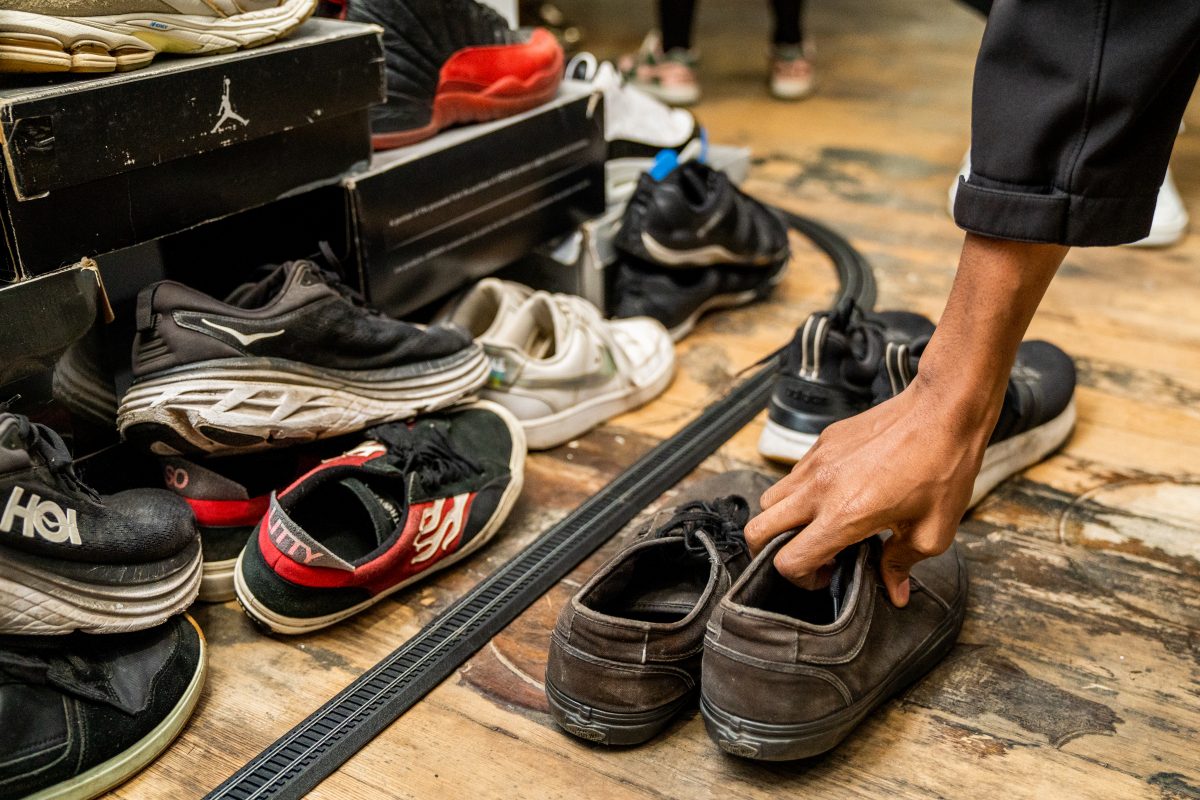
The exhibit prompted viewers to walk in a circle to observe the sequential narrative of a sneaker’s lifecycle – from its parts and materials, to the manufacturing process, to consumer use and finally to the landfill, where viewers brought their own sneakers to recycle. All of the material used in the installations came from reclaimed deadstock and scrap from the sneaker manufacturing process.
“I was always sort of hesitant to make really large installations out of material that was going to be in the landfill,” said exhibit creator Carmen Hull. “That’s what prevented me from building a lot of large scale installations. And so, the idea that we had all this material [that was already headed for the landfill] was really intriguing to me.”

Hull is the principal at XYZ Data Labs and assistant professor of information design and data visualization at Northeastern. She specializes in making physical models of data. She was intrigued by The Footwear Collective’s mission of fostering collaborations between industries to promote circular solutions, and the idea of giving new life to these materials inspired her to repurpose them into build a large-scale project to reimagine the life of a sneaker.
“The real power of making physical models of data is that we can understand it at this visceral level in [relation] to our bodies,” Hull said. “Because we need to understand things in terms of what we already understand, which is our physical space.”
To give viewers a better grasp on the true size of carbon emissions, for example, one part of the installation featured an area with red shoelaces hanging from the ceiling. The shoelaces partitioned off a cube of space, approximately 40 sq ft in size, that represented the volume of CO2 emissions released during the production of a single shoe – 13 kilograms.
“Some of these numbers are so abstract,” Hull said. “It’s really hard to understand what 13 kilograms of CO2 volume is.”
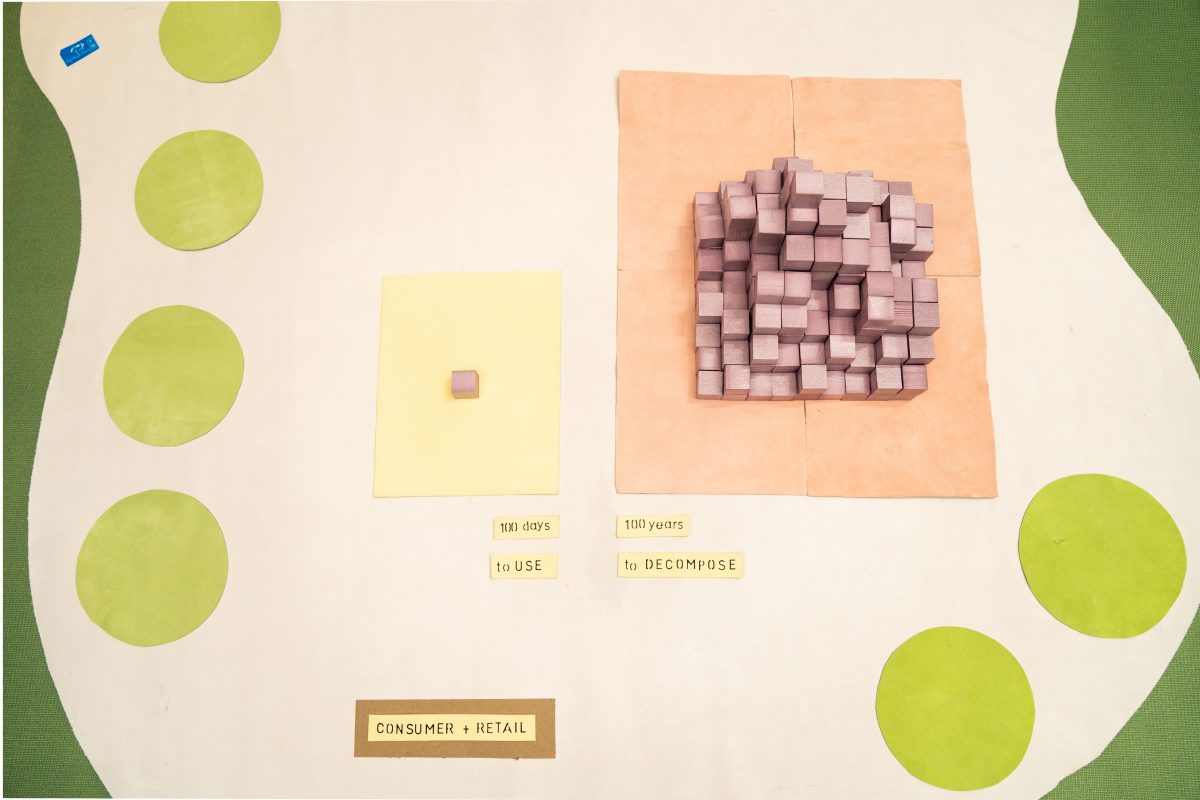
On the other end of the visualization scale, Hull also incorporated miniature-scale models, which allowed viewers to see an overview of a process at a bird’s eye view. One visualization used cubes to depict the ratio of a sneaker’s life in the hands of consumers versus its life in the landfill, with a purple cube on one side and a heap of 365 cubes on the other. One pair of shoes that results in 100 days of use, represented by the one cube on the left, takes 100 years to decompose, as shown by the heap of cubes on the right.

“I think scale is one of our most powerful mechanisms for understanding datasets,” Hull said.
Generally, however, Hull’s exhibit portrayed the lifecycle of sneakers using high-level numbers. Lewis Campbell, who works at the Footwear Collective as a data strategist but was not directly involved in this exhibit, pointed out that the exhibit used statistics from The Footwear Collective and the Environmental Protection Agency that gave a more comprehensive overview, but prompted questions that required more granularity and a more global perspective.
“There are still a lot of gaps in terms of how much we understand about the sneaker [lifecycle],” he said.
Christopher Kuang, an architecture studies and design student at Northeastern who worked on the project alongside Hull, believed that this installation is the start of a conversation that will hopefully spark opportunities to dive deeper into this data and the environmental impacts.
“This is the first step towards more data, more exhibits, and ultimately more sustainable practices in the future,” Kuang said.
Hull plans to take the exhibit on tour, with events planned in Amsterdam and Northeastern’s London campus. In future iterations of this exhibit, she hopes to explore the sneaker lifecycle in more detail and develop visualizations that further investigate the supply chain of sneakers and the recyclability of each sneaker component.
The solutions to our environment’s challenges, Hull said, is not one size fits all.
“It’s not just in the hands of companies; it’s not just in our hands as consumers,” she said. “We all really have to work together.”
- Step by step: Exploring the sneaker lifecycle through data physicalization - February 6, 2024


