Contextualizing the Dakota Access Pipeline: A roundup of visualizations
Since August, thousands of Americans have flowed into North Dakota to help the Standing Rock Sioux and dozens of other Native American groups protest the construction of a 1,172-mile crude oil pipeline that will cross the Missouri River and encroach upon the tribe’s drinking water and sacred grounds. Below, a roundup of visualizations – created by news outlets, advocacy organizations and enthusiastic individuals – that contextualize the Dakota Access protest and North America’s thirst for energy.
The New York Times
The Times, breaking with cartographic convention, turned the traditional pipeline map about 45 degrees to show its path from North Dakota to Illinois in one smooth vertical scroll. Annotations along the way explain conflicts in addition to the Standing Rock protest, including eminent domain seizures in Iowa.
Undark magazine
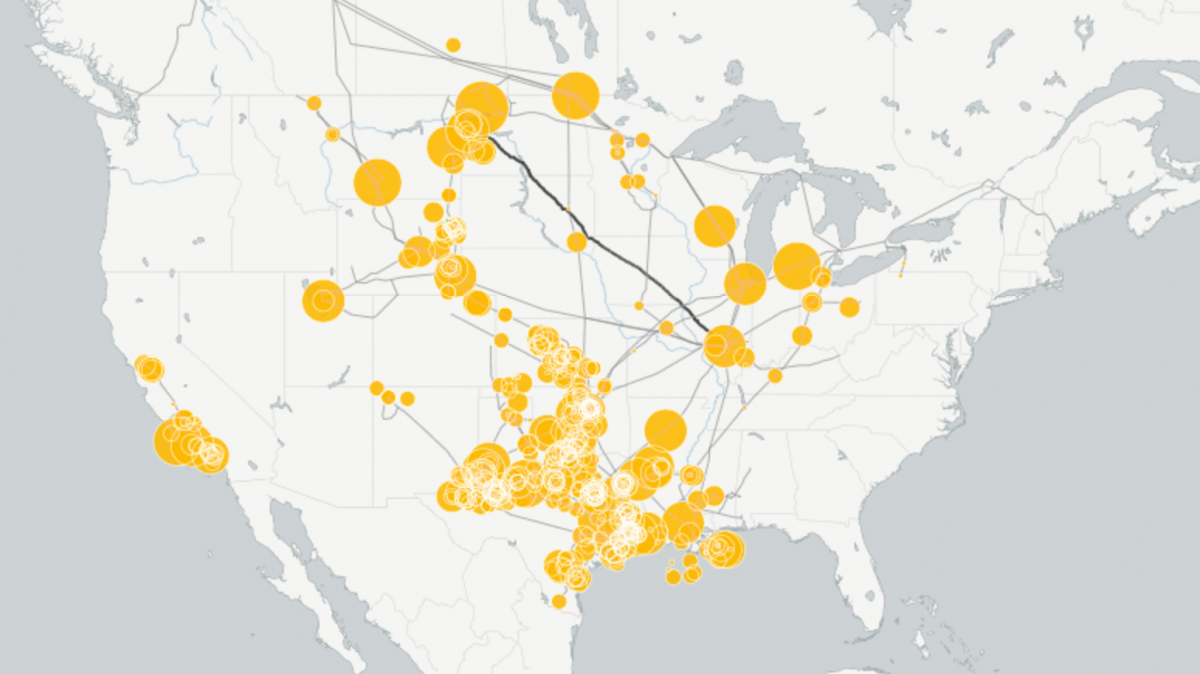
The DAPL protest has illuminated an important question: how safe are crude oil pipelines and what risk does aging energy infrastructure pose to the environment? For Undark magazine, Storybench editor Aleszu Bajak explored those questions using data pulled from federal regulators as well as environmental impact assessments.
Food & Water Watch
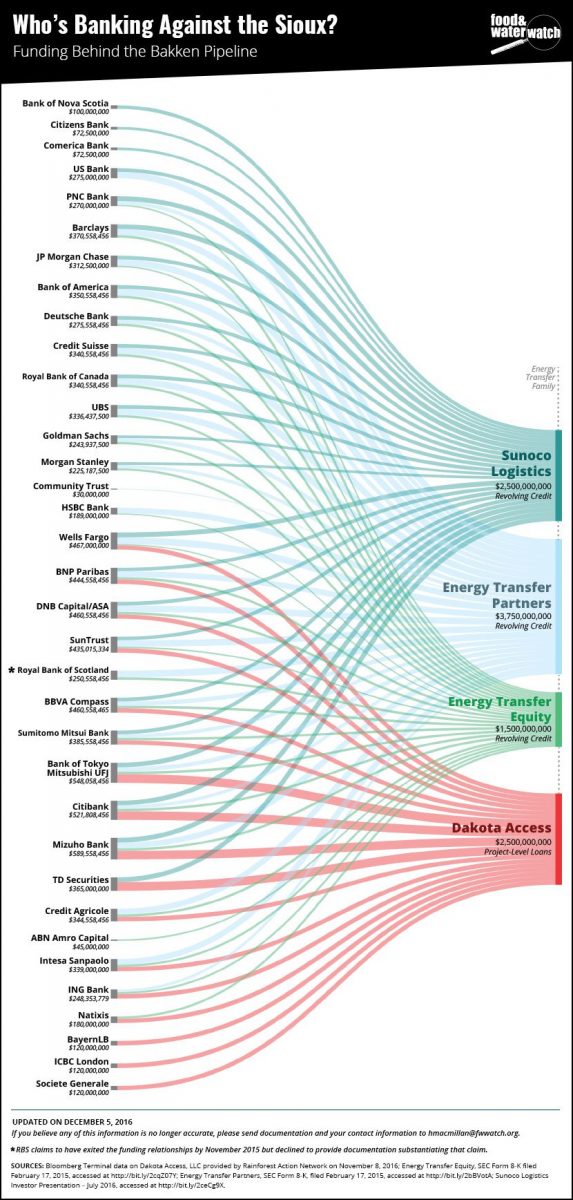
“Who’s Banking on the Dakota Access Pipeline,” from environmental advocacy group Food & Water Watch, put together a powerful Sankey diagram showing the vested interests in the #DAPL project.
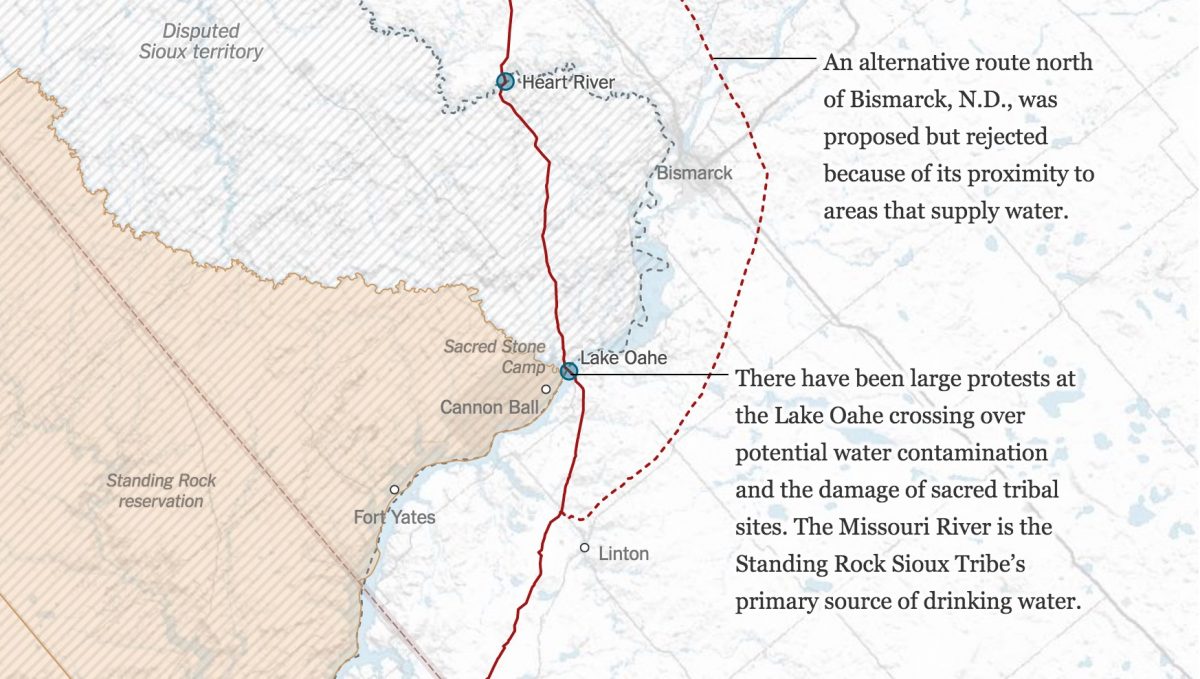
Carl Sack’s #NoDAPL map
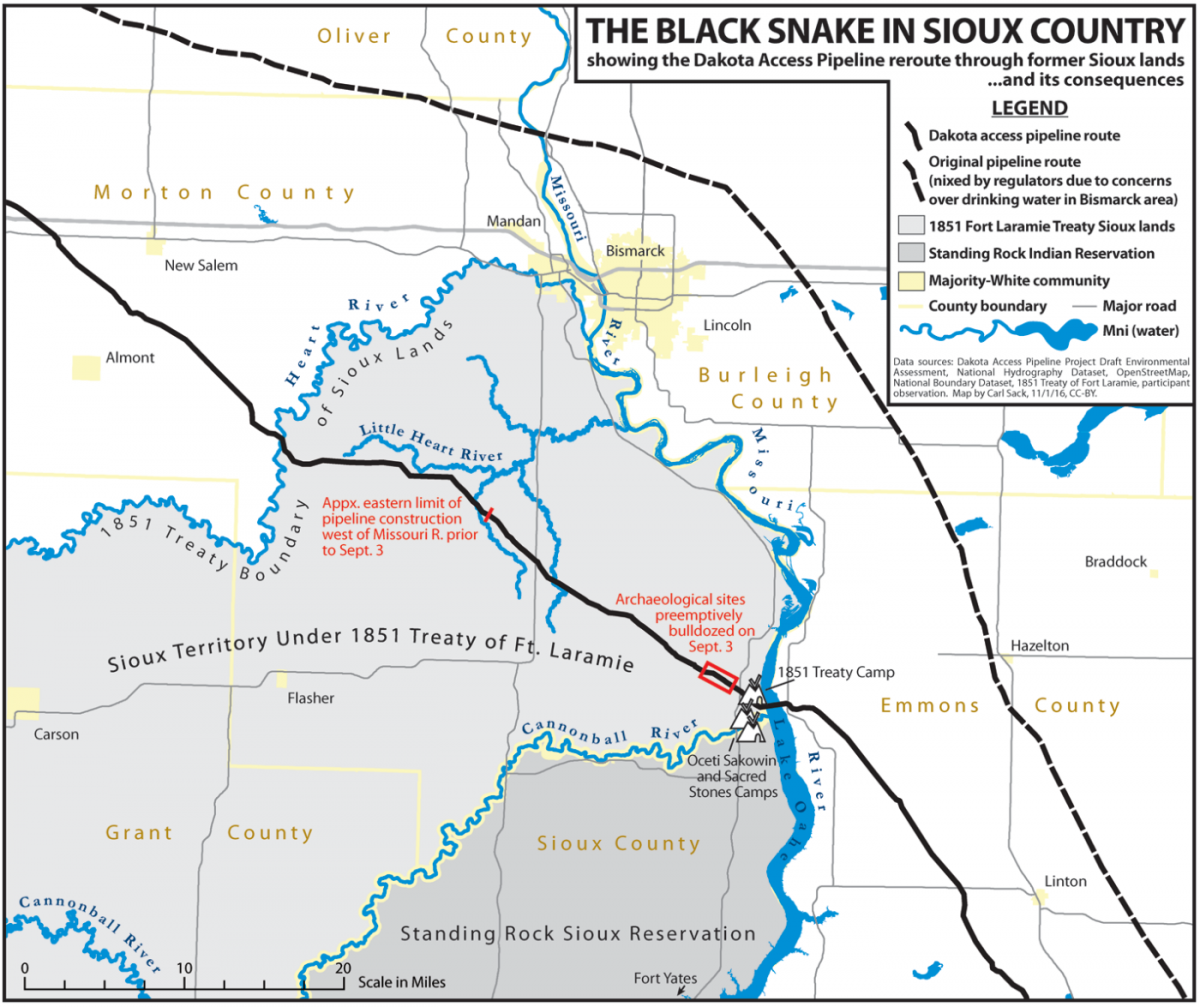
Carl M. Sack, a cartographer at the University of Wisconsin, built a map showing how the original Dakota Access pipeline route, initially planned to bisect the city of Bismarck, was later moved closer to the Standing Rock reservation.
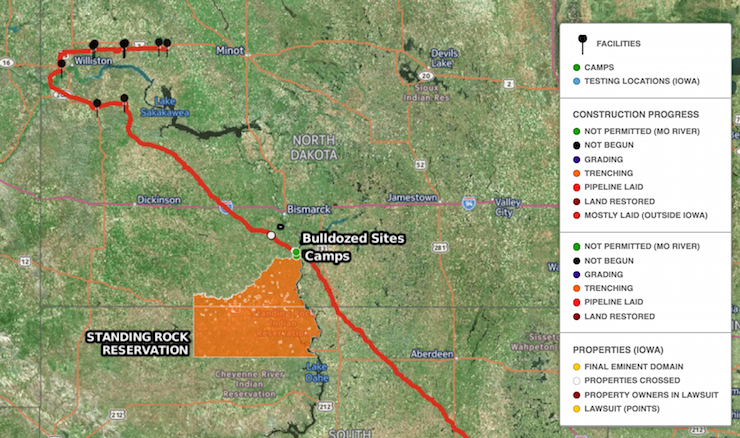
InsideClimate News
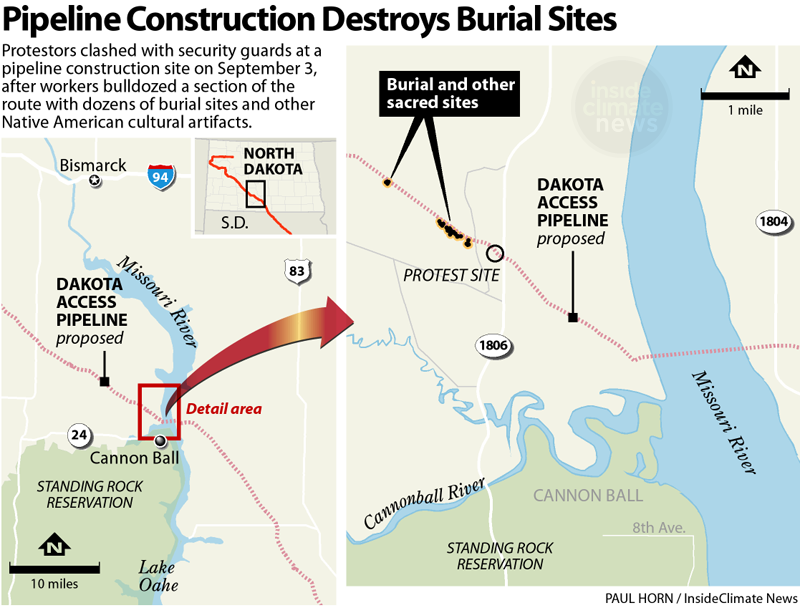
Where are the cultural sites protestors are struggling to save from bulldozers? InsideClimate News has a map.
Bakken Pipeline Map
Nitin Gadia of MapStory.org put together a map of the Dakota Access Pipeline using Leaflet and open-sourced the entire project on Github.
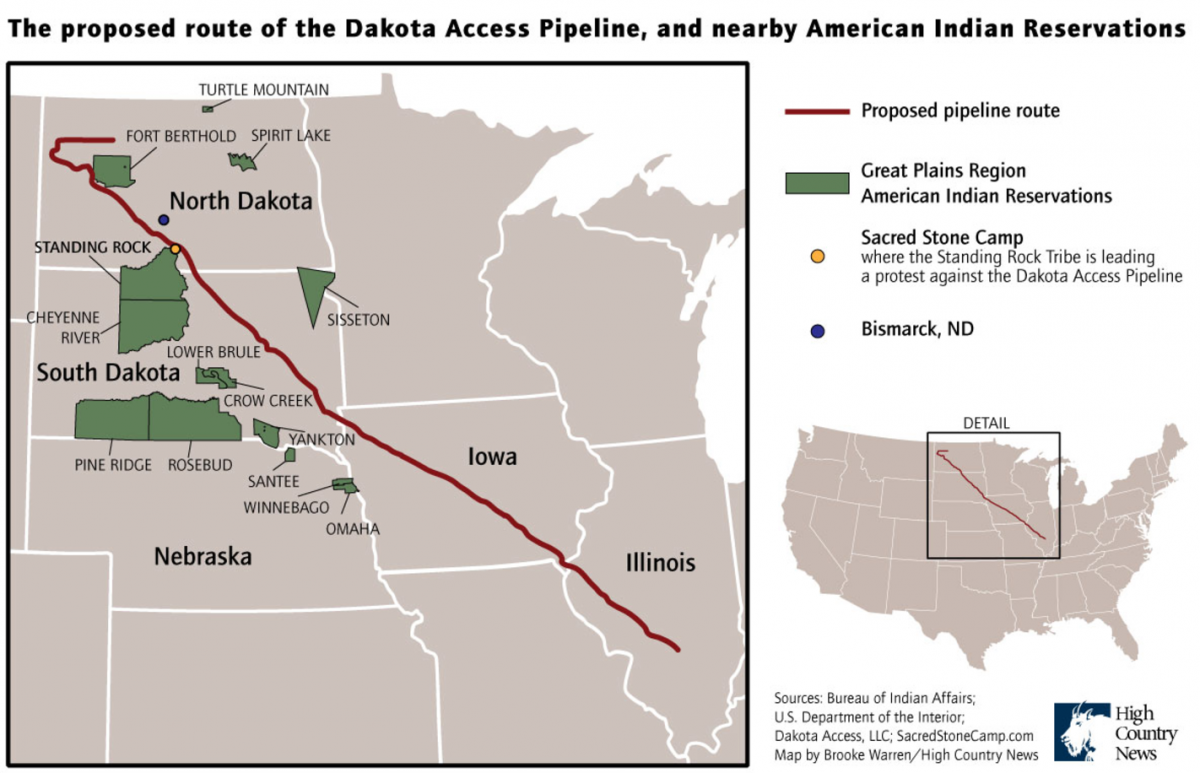
High Country News
The Standing Rock Sioux isn’t the only Native American tribe at the #DAPL protest. In a map from August, High Country News highlighted several other groups nearby.
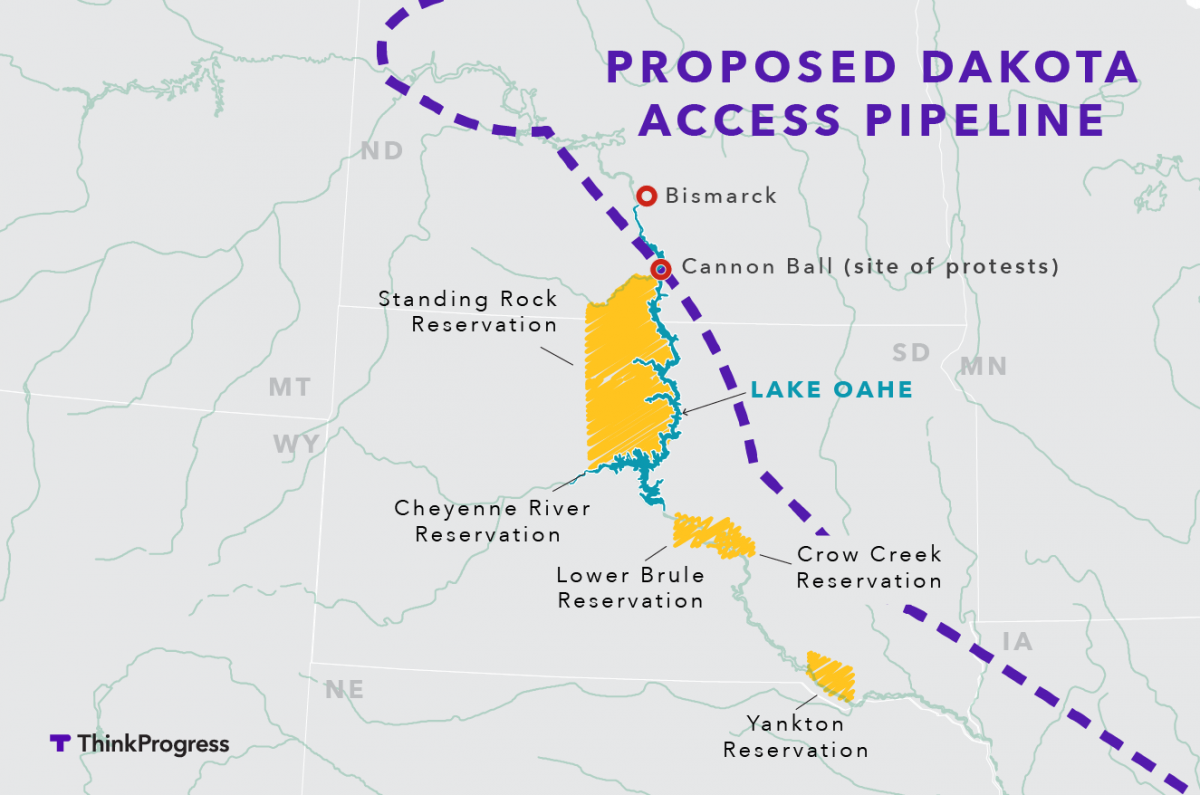
Think Progress
By visualizing Native American reservations, rivers and reservoirs, and a rough sketch of the pipeline route, Think Progress juxtaposed the region’s water resources with the epicenter of the protest.
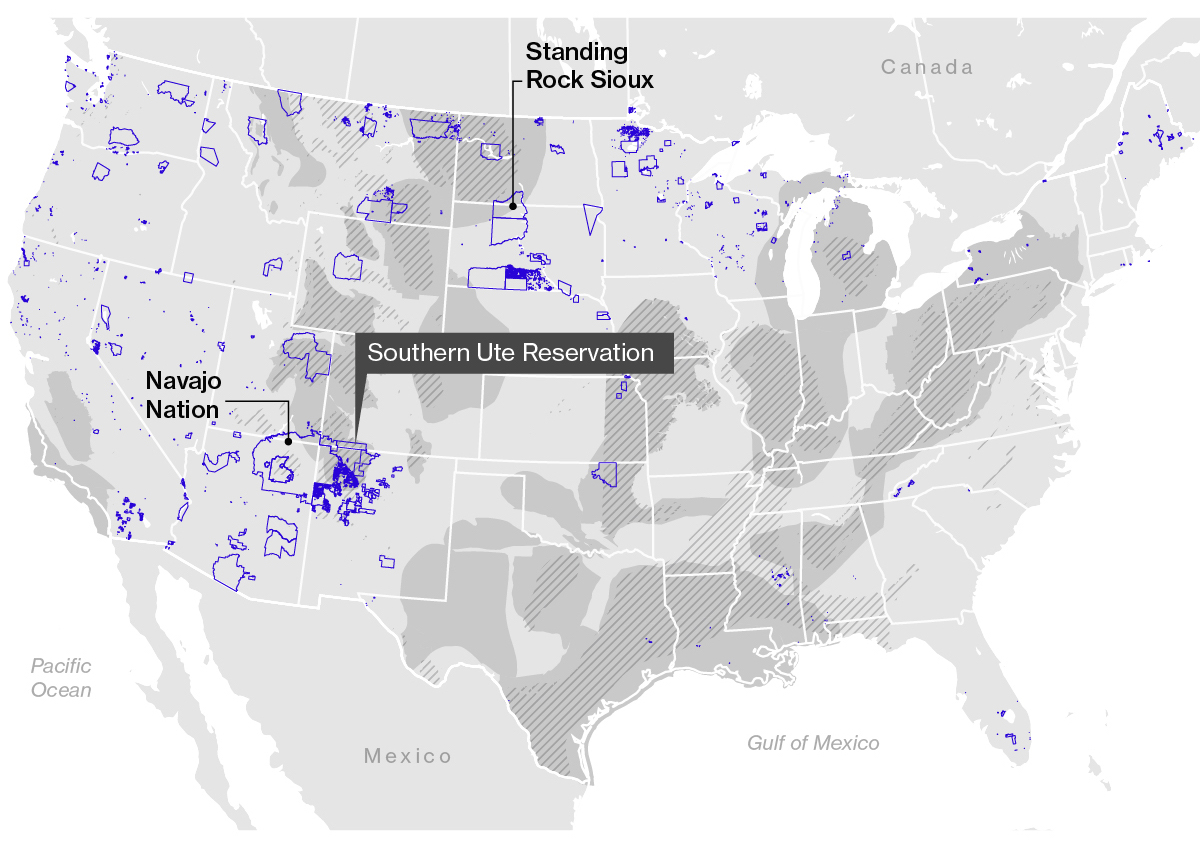
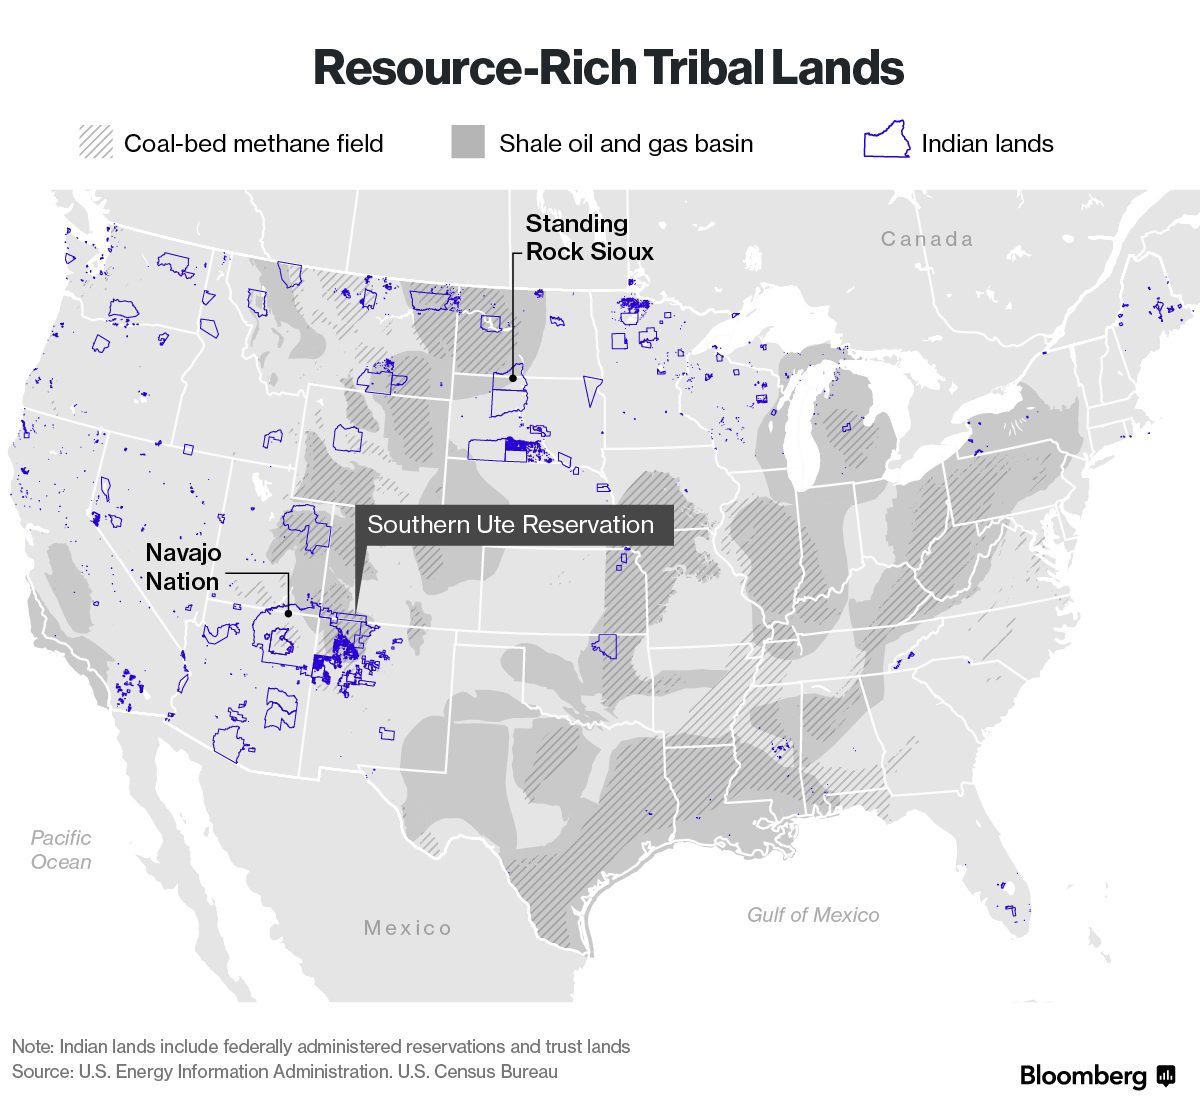
Bloomberg
Tribal lands tends to abut or cover resource-rich areas with coal fields and oil and gas basins, as Bloomberg Markets showed in a map in October.
Historic visualizations of pipelines, spills and the Bakken oil boom
It’s hard not to stumble upon historic visualizations of the themes currently resurfacing in the Dakota Access debate. Here are a few choice visualizations.
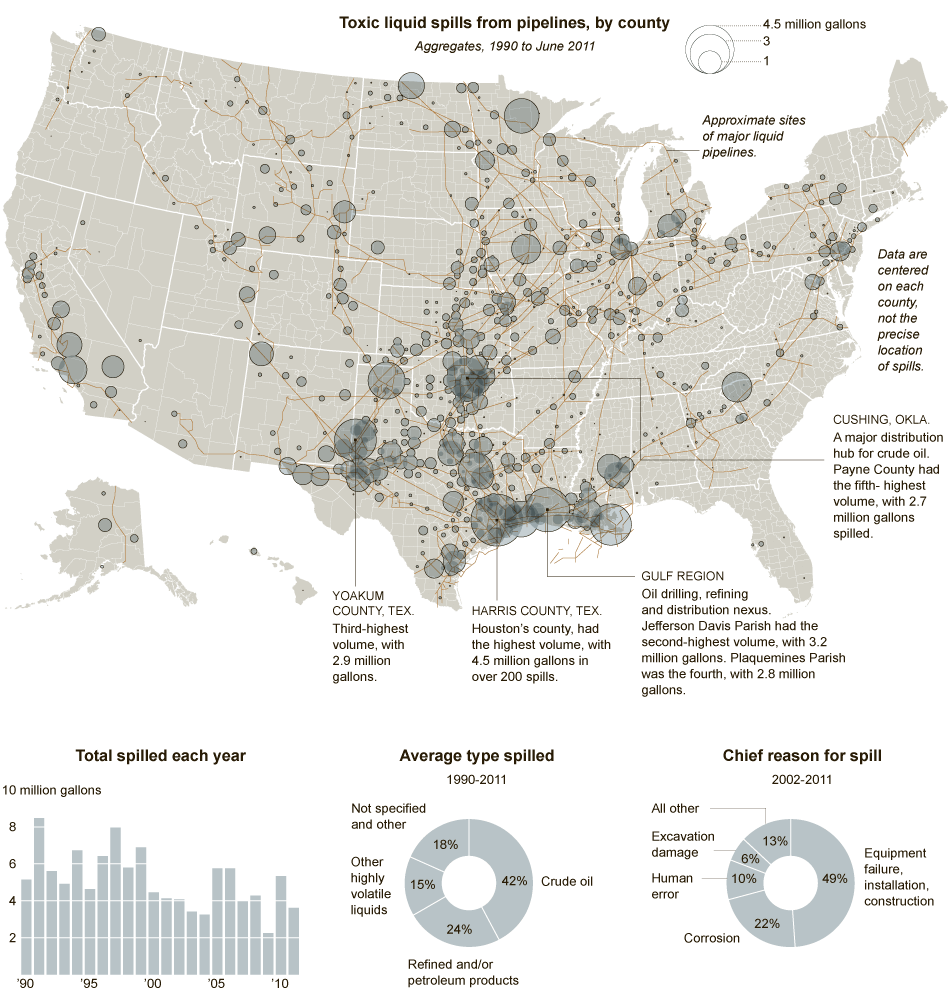
The New York Times
The Times‘ “Two Decades of Spills,” published in September 2011, is worth mentioning for bringing together twenty years of toxic liquid spills from pipelines in the United States.
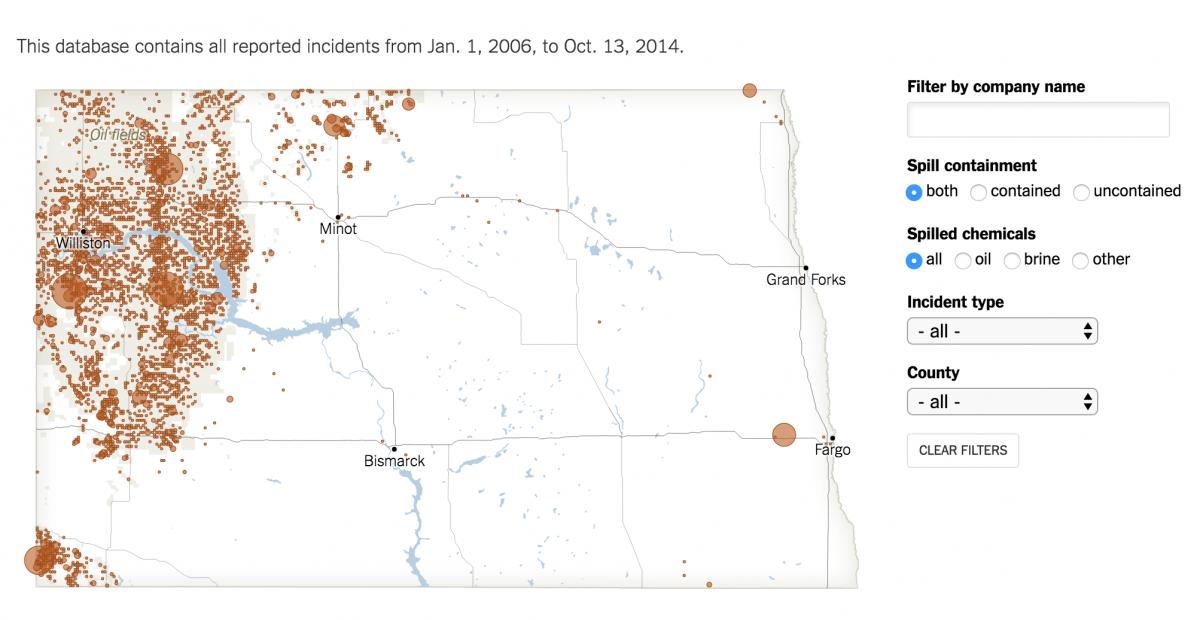
In 2014, the Times published a database of environmental incidents in North Dakota’s Bakken shale region. Data can be downloaded as a CSV here.
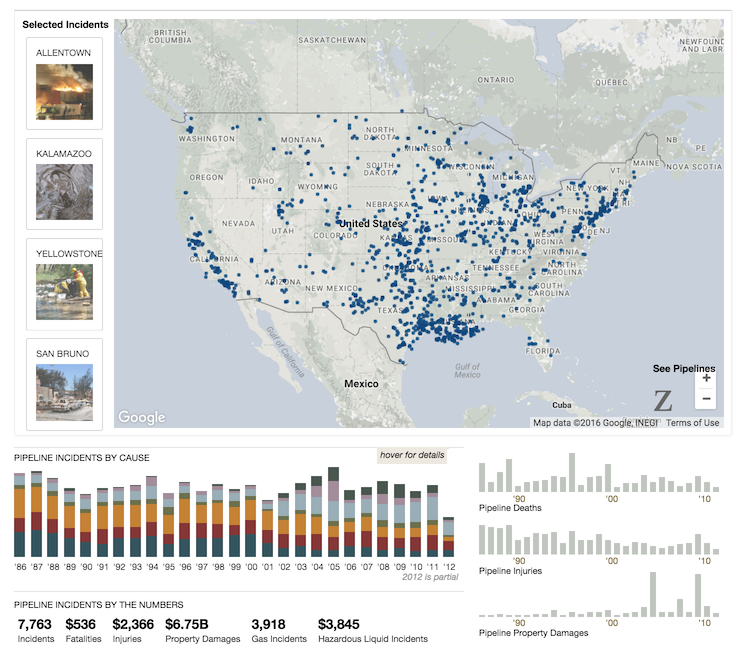
ProPublica
In 2012, ProPublica put together a dashboard allowing users to track, compare and map pipeline incidents.
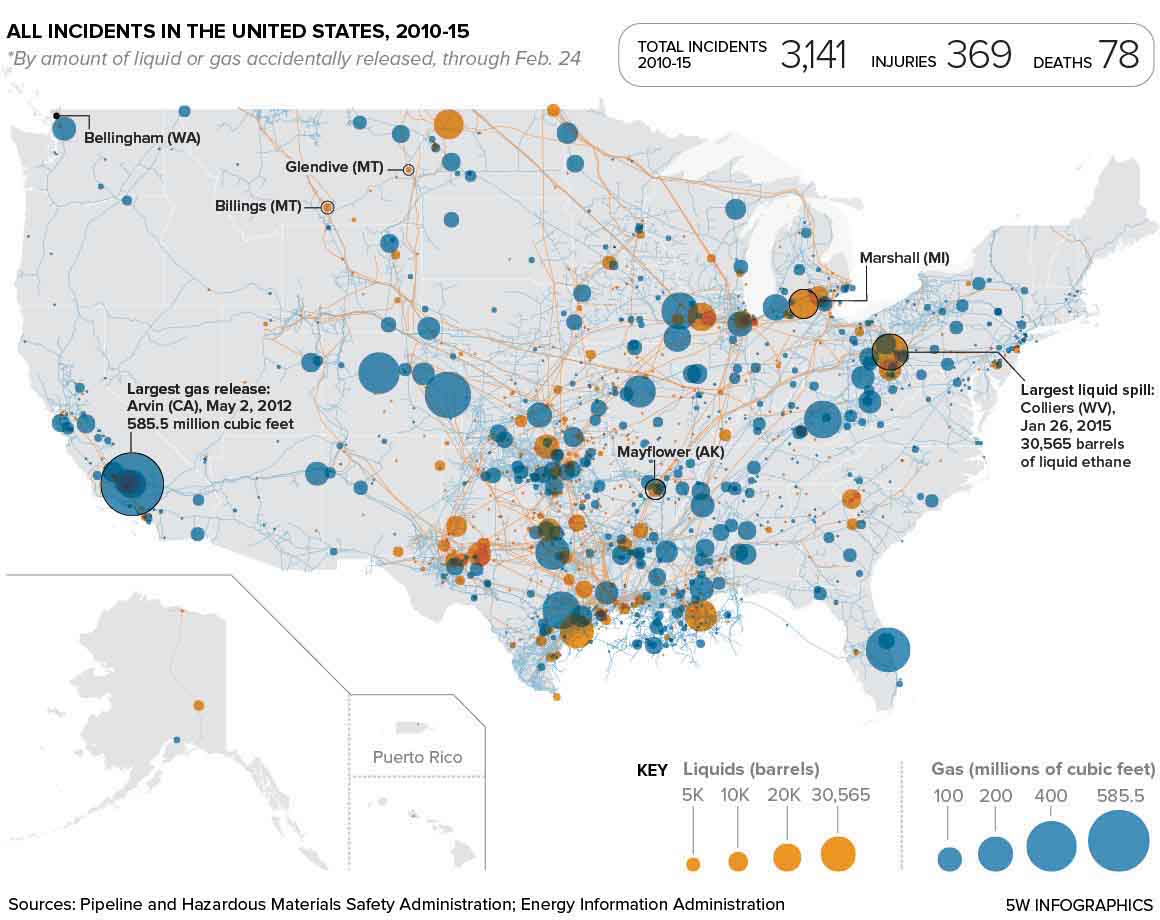
Politico
The federal agency tasked with regulating pipelines is a “can’t-do agency,” a 2015 Politico investigation concluded, teaming up with 5W infographics to produce a flurry of visualizations.