Nine digital storytelling projects from last weekend’s Build the News hackathon
Journalists Alli Shultes, a graduate student at Goldsmiths University of London, and Maria Crosas, a graduate student at Birmingham City University, met at the “Build the News” journalism hackathon last weekend in London.
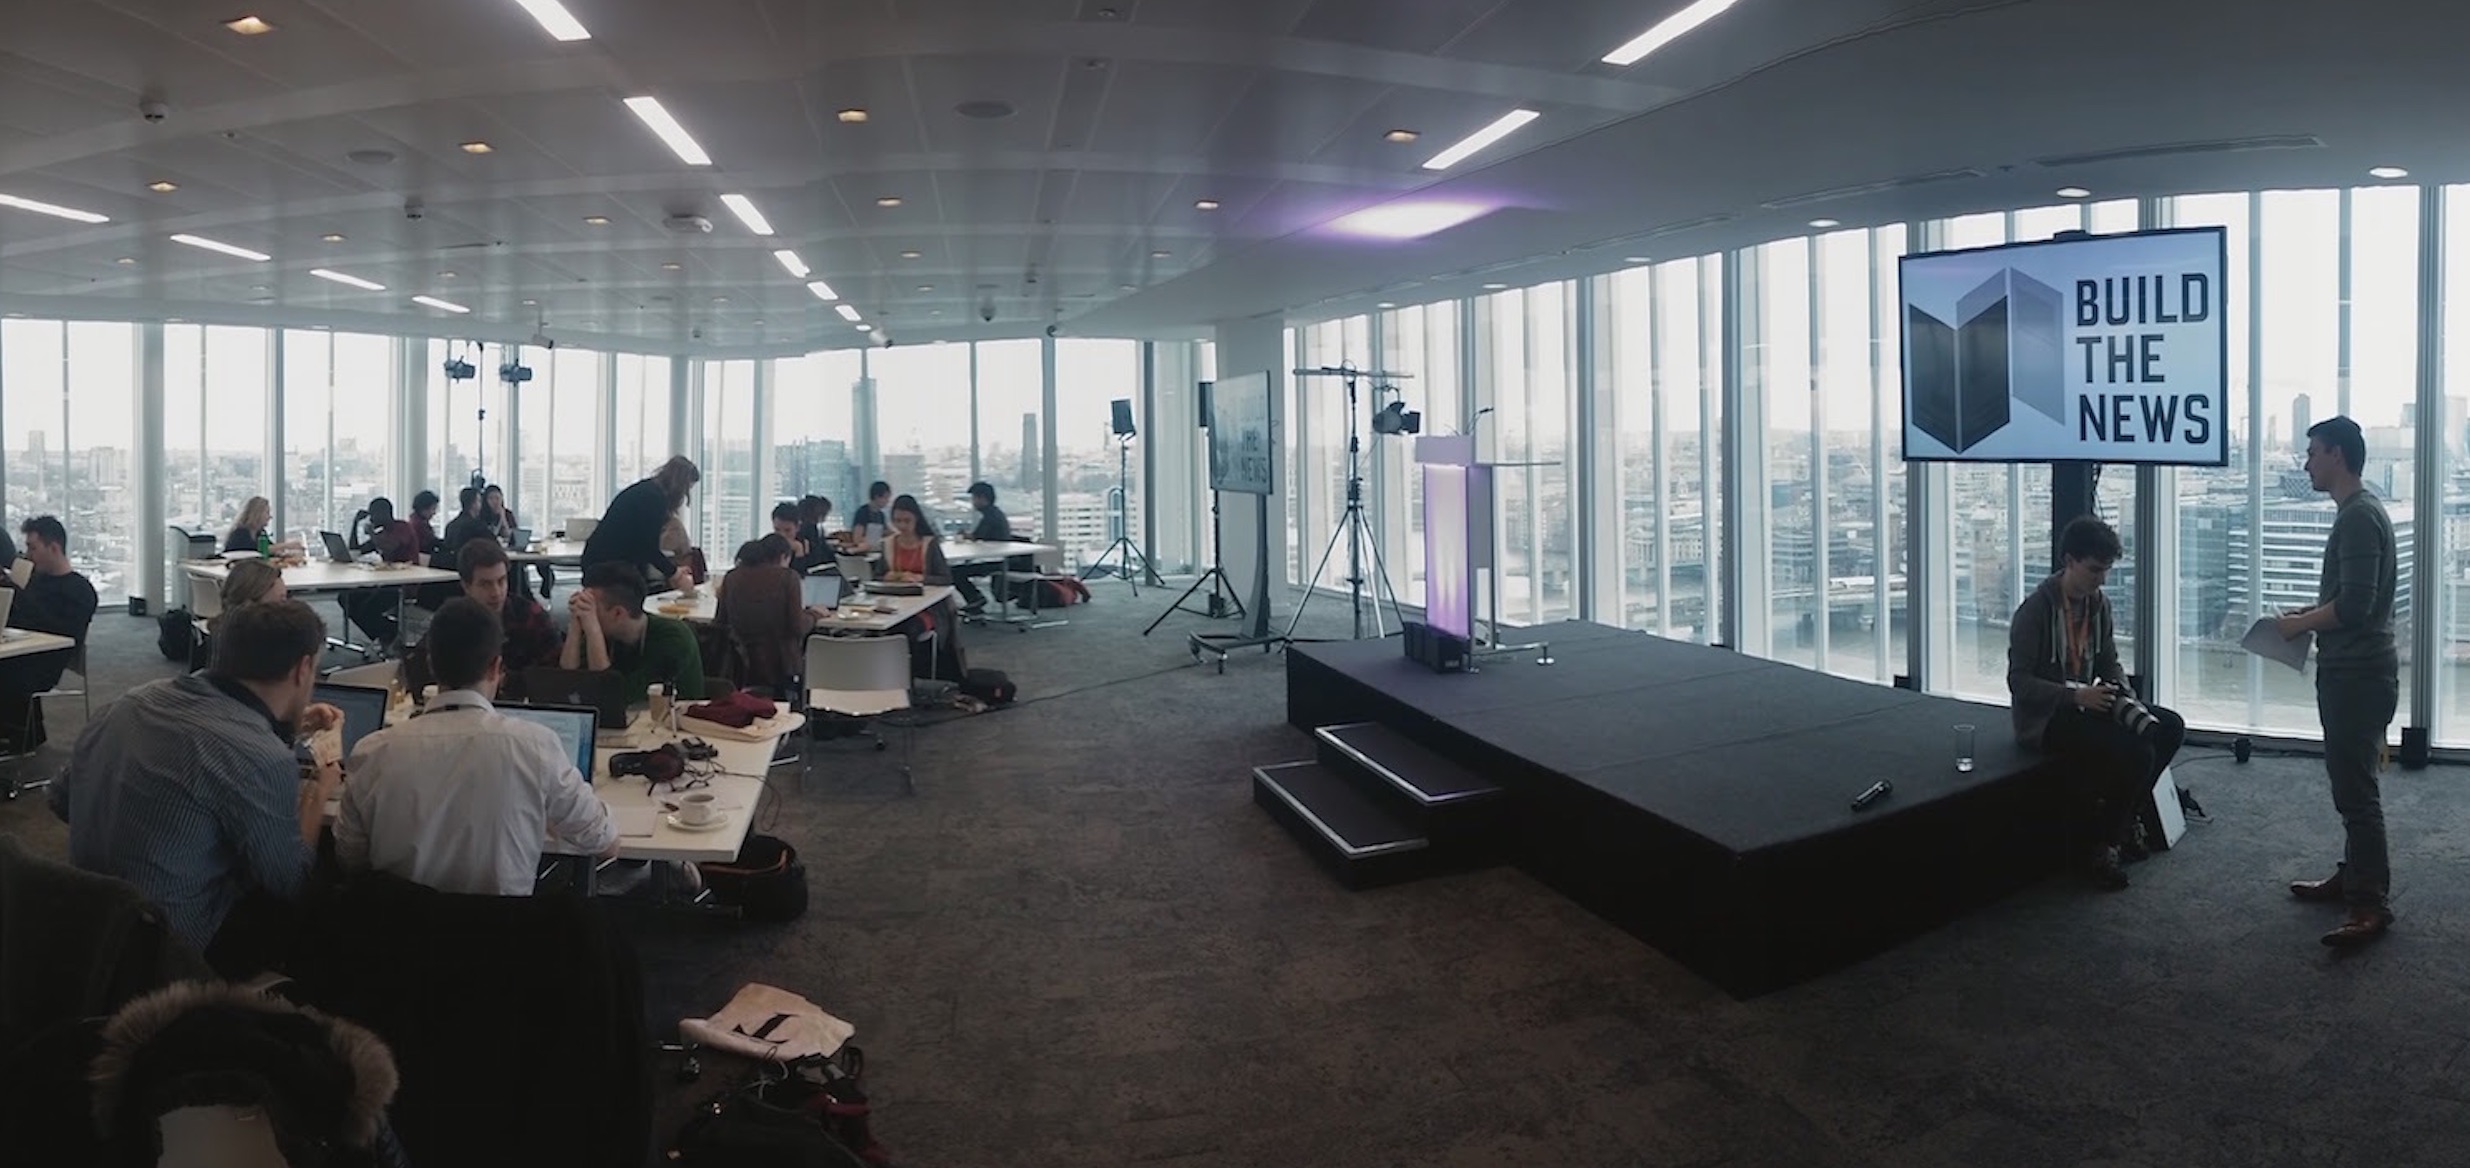
A Tinder app for bug burgers? Mapping private schools around the U.K.? What does effective digital storytelling look like? Last weekend, The Times of London and Sunday Times challenged teams of students to construct their own answers at its annual #BuildtheNews hackathon.
The event took a different direction from previous years, moving away from solutions-based development to focus on strong storytelling across platforms. Organizers encouraged students to crunch data, interview sources and send freedom of information requests before arriving, and then develop their pieces over the weekend.
While digital tools featured heavily in student work, we learned that you don’t need to have serious coding chops to deliver important stories to your audiences. Here’s a look at what the nine teams pitched at the end of the two-day event.
https://vine.co/v/idjKZvz7tar
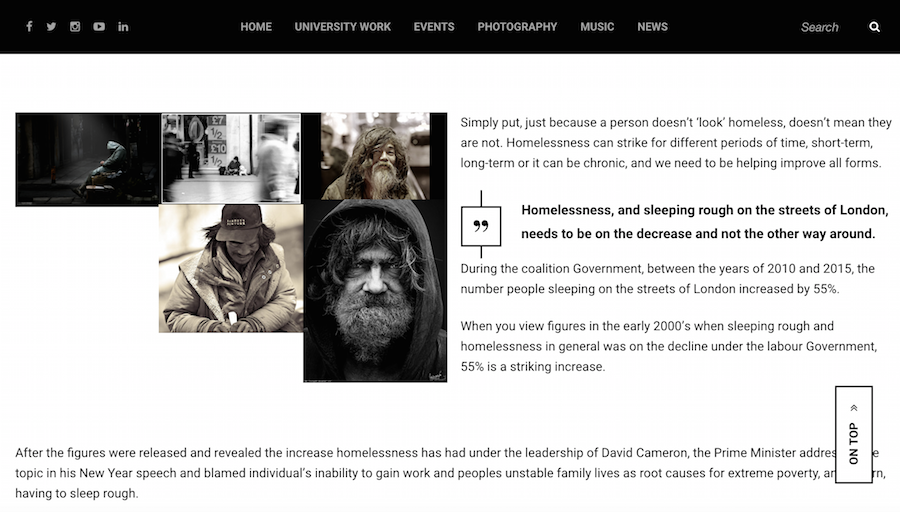
Homelessness stories using Snapchat – Southbank
How can journalists humanize stories that are typically told with statistics? Students from Southbank turned to Snapchat and Flickr, featuring homeless Londoners’ experiences through visuals.
What we learned: Think beyond more conventional social media channels. Create a branded campaign to engage readers.
Machine learning and Google AlphaGo
How can journalists point audiences to contextual reading? A team of neuroscientists and web developers built a nodal network that allows readers to visualize connections between different stories. From their primary article on the defeat of the Chinese Go champion by the computer AlphaGo through machine-learning technology, users can dive through a color-coded web built with D3.js to find related stories.
What we learned: Nonlinear doesn’t just have to mean user-directed.
Tinder — For Bugs?
Bug burgers may be well and good in the hypothetical – as an alternative, sustainable source of protein in a less food secure future – but the true test of a product’s success is on Tinder. City University of London’s team explored users’ appetite for bug burgers and maggot-filled lettuce wraps with a Tinder-inspired app.
What we learned: Challenge readers when it comes to platform — and make them challenge their own assumptions.
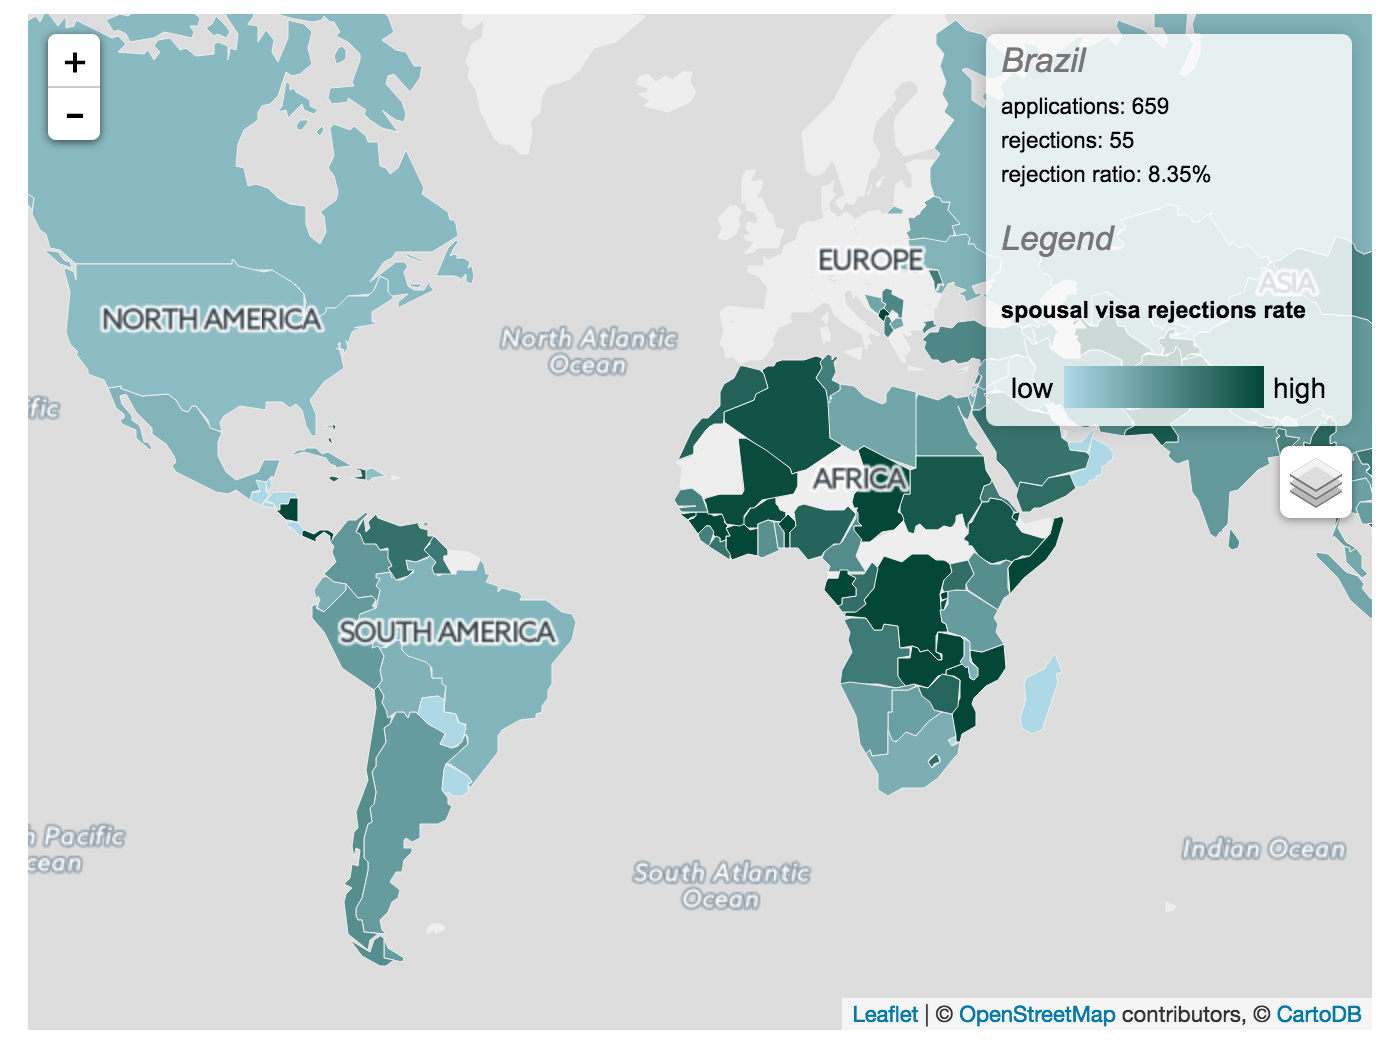
Marry right or live abroad – Cardiff University
Cardiff University’s project was a FOI-backed investigation on how the U.K. privileges the wealthy and Western when approving spousal visas. An interactive choropleth map and a slider filtering the number of Brits that can afford foreign spouses complement the longform feature.
What we learned: Global data should exist hand in hand with customizable numbers. And on a journalist’s salary, better to stick to dating E.U. nationals than break the bank.
https://twitter.com/alessioperrone/status/711962706635591680
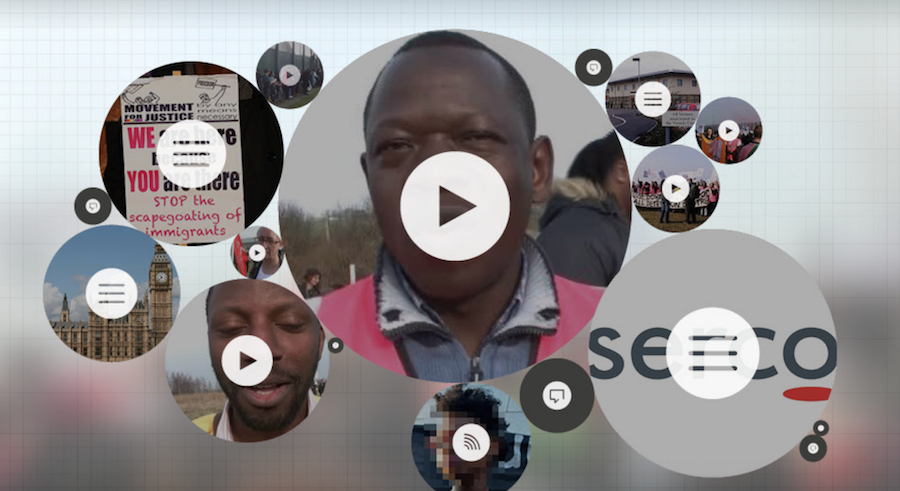
Yarl’s Wood detention centre – Leeds Trinity
Leeds Trinity University developed a visualization tool that allows users to interact with video content. Each bubble presents experiences in different platforms and allows the reader to explore the topic as they want to.
What we learned: An interactive layout can encourage engagement and the center of the story.
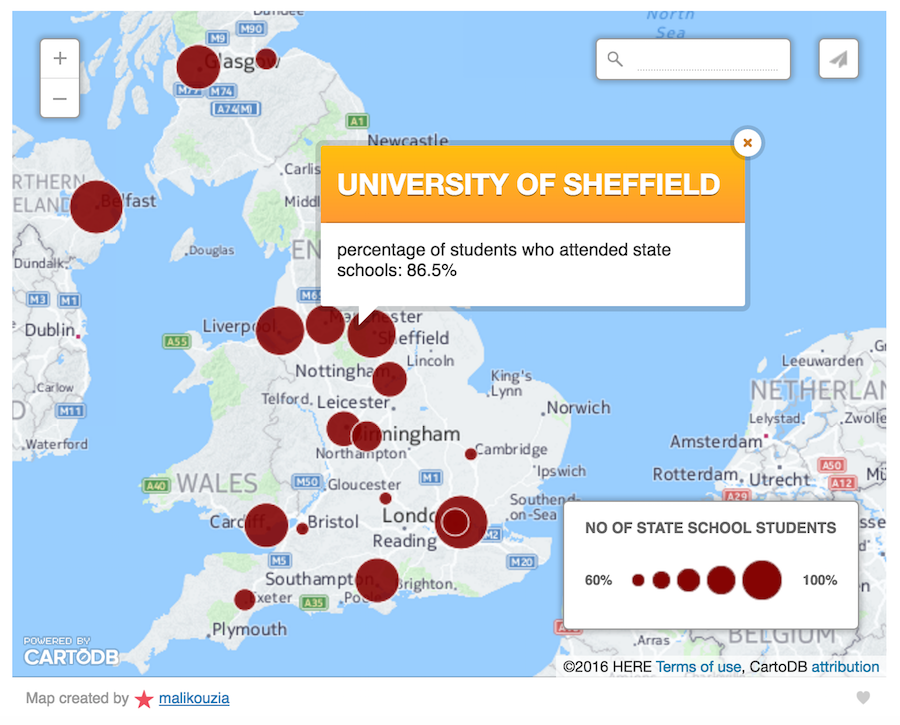
Bristol University dominated by private school students – University of Bristol
Students from the University of Bristol mapped the proportion of state school students at U.K. universities before delving into the case study that launched the project: the “ghettoization” of public school students at their home university. By focusing on local context, Bristol’s team was able to give their data-driven feature human characters by interviewing students within Bristol’s halls.
What we learned: Who said you need to code to display data? CartoDB can be used by a wide range of journalists to depict comparable data and works really well.
Rough sleeping on buses – City University and Goldsmiths College
After a London charity made headlines by giving out bus passes to rough sleepers, this team investigated the rise of homeless riders on London’s N25 bus. Working with a leaked document and collected interviews, the team built an animated map that interspersed images and audio along the bus’s route.
What we learned: If you want to map your story, make it hip. And make it fly with Mapbox GL JS.
Spying on Banksy, spying on you – Birmingham City University
From a paper that used geographic profiling to identify Banksy, the English graffitti artist, Birmingham City students used technology like Google Cardboard and Holobuilder to present a story in a way that might be more appealing for younger audiences. A longform website served as the gate to supplementary features like a virtual reality shot and Telegram bots. Experts on profiling interacted with users through videos, audio and a Q&A menu.
What we learned: Added technologies like 360-degree photography can build an immersive experience and bring a story home for readers.
Our story: Spying on Banksy, spying on you for your laptops and mobile #buildthenewshttps://t.co/18JAxjxCoQ pic.twitter.com/bJiqXy4zCM
— Maria Crosas (@mcrosasb) March 20, 2016
They've built a Telegram bot with preset answers, similar to Quartz's new app #buildthenews pic.twitter.com/T82HPNX4t5
— Elliot Davies (@elimoto) March 20, 2016
The Housing Crisis: What it means for generation rent – University of York
Wading into a statistical salvo of housing figures, students from the University of York aimed to bring the crisis home to readers. Using an interactive input design, the story targeted a millennial audience by testing their expectations against the reality of where they can afford to buy a house.
What we learned: Make numbers work in your stories by testing assumptions and tailoring data.
.


