
Animating the pandemic: TV storytelling techniques in the time of Covid
The global Covid-19 pandemic has forced every industry to evolve as a new normal sets in. This is no different for local television news.
Having to work from home, tell stories with limited visual elements, and not get close to any story subjects provides an extra layer of difficulty for those out in the field. But TV stations across the country are getting creative to help reporters tell successful and engaging stories.
Northeastern University School of Journalism’s Reinventing Local TV News Project has leveraged a partnership with WLS-TV in Chicago and WCVB-TV in Boston to embed visual content producers who specialize in animation in their newsrooms. Their work is demonstrating how every local station could embrace innovation to grow the audience and help ensure broadcast television will be viable for years to come. The visual content producers have given the stations’ reporters the ability to tell more visually compelling stories, especially in a time where visual elements can be difficult to obtain.
“It was pretty busy before, and it’s still pretty busy right now,” said WLS-TV’s visual content producer Adriana Aguilar.
Both stations have been able to more effectively convey the often data and numbers-heavy coronavirus stories. Aguilar says that’s where her work comes into play.
“There’s just been a lot of data coming now in terms of hospitals, hospital capacity, hospital beds, hospital ventilators,” she said. Medical stories aren’t the only area where her animations are being put to use. She says they have also been utilizing her expertise to show crime data trends because “all that stuff needs visualization essentially and so they’ve really had a lot of things for me in the last couple of weeks, actually.”
In order to get these numbers though, Aguilar has to work closely with her station’s data visualization fellow to get an understanding of what exactly she will be working with.
“[Adriana will] be one of the first people I speak to when I’m working with a dataset, because I know what kind of graph it might look good in, but I’m not an animator,” said Jonathan Fagg, WLS’ data visualization fellow. Fagg is able to contextualize the numbers and collaboratively come up with ways they can display them in an engaging way, which he says is where their most positive work comes from.

“I think the projects we’ve had which have been most successful are the ones where we’re both having creative input into working out how this is going to look,” said Fagg.
One story Aguilar and Fagg were able to collaborate on effectively was a story about Illinois’ spike in firearm purchases. Fagg was able to find and contextualize the numbers necessary to tell the story. Aguilar was able to visualize that in a compelling way for viewers.
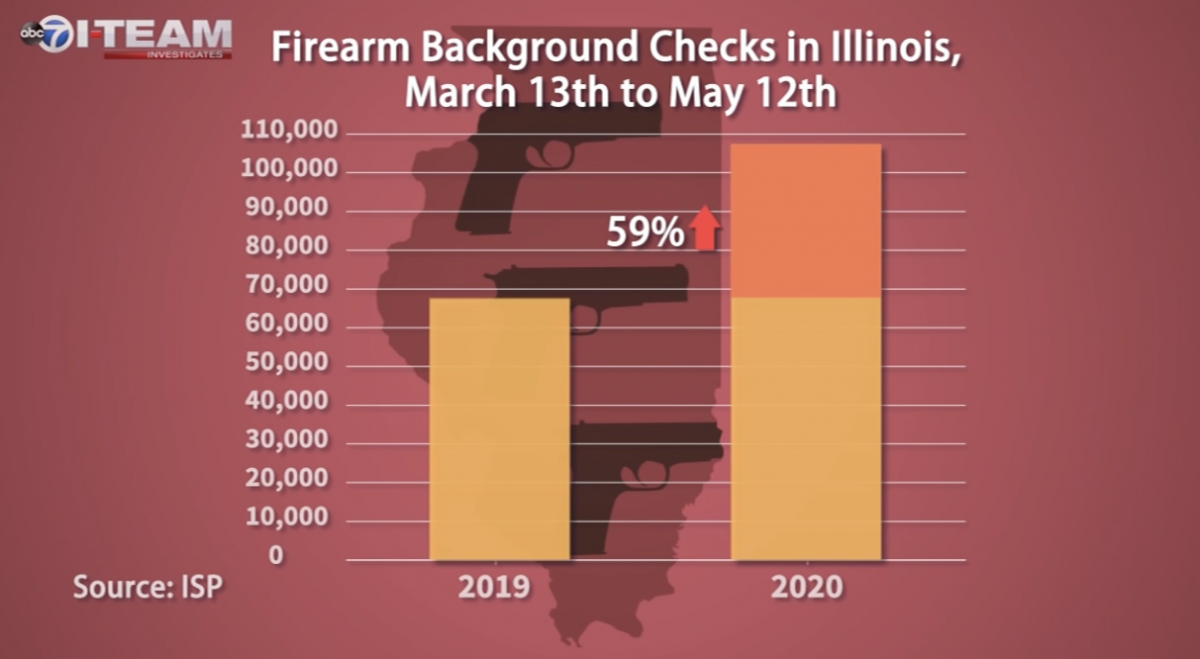
Stories like these can often lack both context and visuals. So, through both of their work they were able to more successfully tell the story.
When the stories are more successful and visually compelling, the hope is viewers will be more engaged and come back for more. Through their use of animation, WLS-TV has been able to showcase the scary and complex reality of the pandemic — something other stations have not been as successful at doing.
Unfolding stories like these can’t be predicted, but in an increasingly complex world stations can take steps to properly equip themselves with resources that can make their coverage stronger and more impactful for viewers.


