How FlowingData’s Nathan Yau thinks about data stories
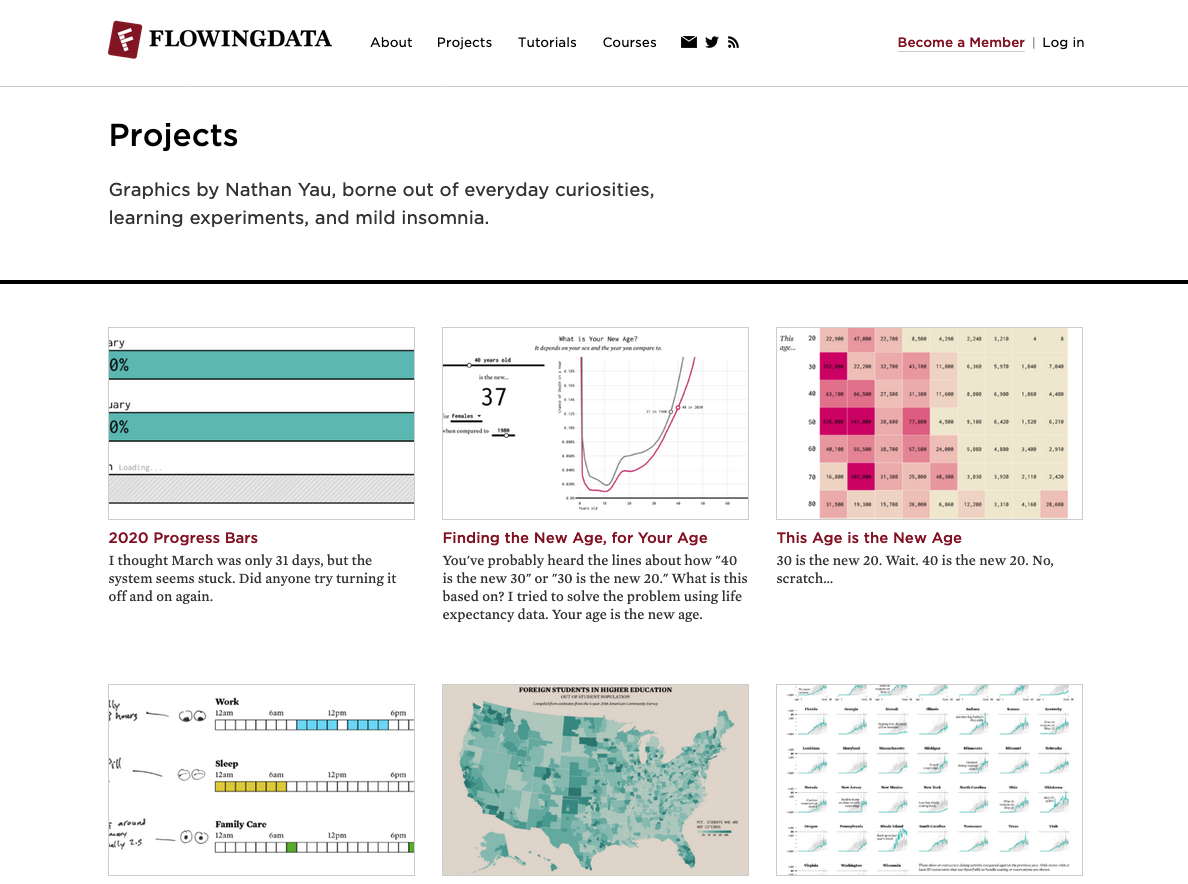
Nathan Yau, the founder of the website FlowingData, has been creating and discussing data visualization projects since 2007. Browsing through the site reveals no single theme; instead, there is a mix of traditional data analysis, compelling visualizations and commentary on popular visualizations published around the web. Yau’s own projects cover a wide field, from labor to race to parenting.
Yau’s series on mortality and causes of death was a winner for the best graphic design and visualization by Co.Design’s Innovation by Design Award. Two of his visualizations were also featured in the Best American Infographics 2016. Storybench sat down with Yau to chat about his inspiration and tools for projects, why he thinks everyone should understand data, and why visualization is the best way to do so.
What was the inspiration behind launching FlowingData?
I needed online hosting for a class project in grad school and it came with a free domain name. It was for a class called “Data Flows,” and after some poking around for name availability, I landed on FlowingData.
I was at UCLA and ended up having to study remotely in Buffalo, New York, so with the hosting and domain already in hand, I started a blog to catalog things I liked and to share with my classmates in California. I gave a talk last year on how things sort of came together.
How do you come up with ideas and what does your research look like for each idea/project?
More about this also in the talk above. But it comes from everyday questions that I happen to try to answer with data. I think we all have everyday curiosities and they just kind of pass or we do a quick web search. I just gravitate towards data, and because FlowingData is my full-time job, I’m always thinking about how I’ll present the results.
That almost always means visualization. It’s the best way to communicate data to a general audience. Although I tend to pretend I’m communicating to one of my friends I’ve known since childhood. Probably why FlowingData tends to be more informal.
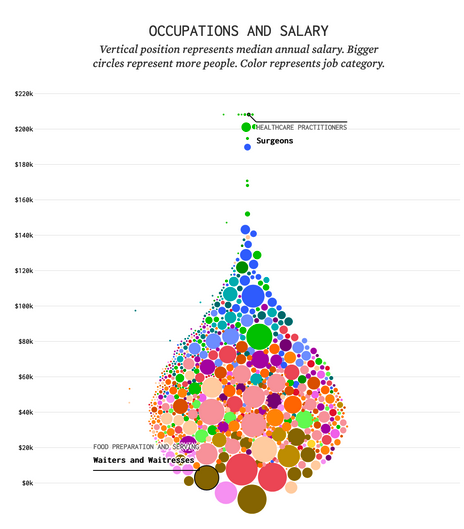
Variations in salaries across occupations based on data from the Bureau of Labor Statistics. Credit: FlowingData.
Research-wise, I think I go back to my grad school days of analysis and reports. I go in with a question and that always leads to other questions. That points me towards different paths.
I used to spend a lot of time with a dataset before I published anything, but it got harder when I had kids. So I tend to do everything piecewise. I kind of treat FlowingData like a personal journal, but I make charts instead of write entries.
Do you mind sharing how you make money off of FlowingData?
It’s a patron system. Most of FlowingData is free to access and readers can support the site if they want/can with membership. Members get additional access to additional resources like tutorials and courses. I started memberships in 2012, and I’ve been fortunate that readers have helped me keep FlowingData going full-time.
How much time does a project usually take from start to finish?
Oh it’s all over the place. I stop once I answer my initial question. But again, it’s kind of piecewise these days and I skip around a lot. If I get stuck, I might put a project on hold, try something else, then come back to the stuck project later.
Did you learn R and D3.js on your own?
I learned R in college during my first non-intro stat class. I was an EECS major at Cal at the time, before I switched my focus to Stat, so the concepts weren’t completely foreign. D3.js came much later, but yeah, I learned it on my own (and my code probably shows it).
You have published nearly 300 projects. Which one is your favorite and why?
https://flowingdata.com/2015/12/15/a-day-in-the-life-of-americans/ – Time use again. Before I got this visual metaphor working, I had been trying to figure out how I could show individuals and still show general patterns. At the time, this wasn’t that straightforward to do.
http://projects.flowingdata.com/atlas/ – So much government data.
https://flowingdata.com/2014/01/16/famous-movie-quotes-as-charts/ – So dumb but was fun to make. I like how charts can be used outside their intended purpose.
How does your PhD come in handy while doing these projects?
Data is so fuzzy. So I’m always thinking about uncertainty and what the means and medians actually represent.
Why do you think everyone should understand data? Why is visualization the best way to get there?
Without a technical background, it’s challenging to understand how all the numbers relate. There’s a lot of it. Visualization lets you see the patterns yourself without having behaviors with an equation. Sometimes you can even feel the data. So you see how you relate to others, how others relate to you, and how everyone relates to each other.
Could you share some of the projects that you are working on right now?
I’m on a statistical atlas kick as of late. It’s grown especially important and useful to see what this country is about. But, again: kids, pandemic, piecewise. I’ve also been slowly expanding FlowingData beyond myself. There are lots of tools to make charts, and so I’ve enlisted others to help how to make charts with tools other than base R. I prefer a more agnostic approach instead of sticking with a single tool all of the time.
What would your advice be to students in data visualization and data journalism?
Data visualization is usually the end result. You have to analyze and understand your data before you can visualize it usefully for readers.