Clicks are a vanity metric. Here are some story analytics you should be worrying about.
Clicks, time-on-page, likes, shares, bounce rate, impressions. With so many metrics to consider, which ones should journalists be worrying about?
After crafting that prize-winning article – which included researching, writing, coming up with a headline and finally getting it published – you’re probably going to want to share it. Typically, you then post it to Facebook or Twitter and there are usually two ways things go.
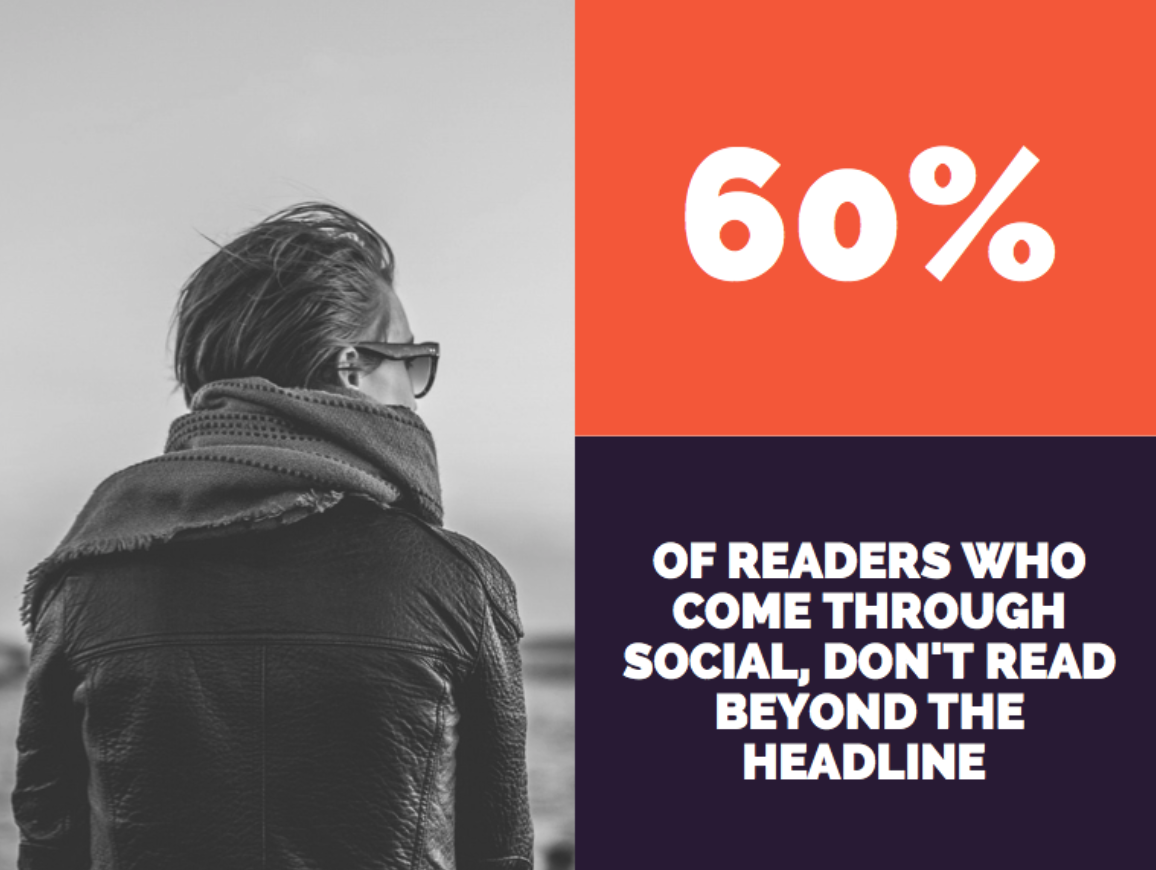
In the first scenario, very few people see your post or read your story. This happens for a number of reasons, none of which should really reflect the quality of your article. You failed, in most cases, to even get them to see your work, so what this really means is that you wrote a bad ad for your content, or that you chose the wrong image for it, or maybe that you targeted it wrong and it didn’t hit the audience you’d hoped it would. Or maybe you just so happen to be on the losing side of this statistic: 60 percent of readers who come through social don’t read beyond the headline.
Whatever the reason, a lack of clicks rarely has anything to do with the standard of your work. So why, if the second scenario plays out – and lots of people click – do we congratulate ourselves and take this as a sign that our articles are great when all it really means is that this time around you nailed that digital ad?
Clicks don’t tell you much
Clicks are a vanity metric. They tell you nothing about how your readers are consuming and interacting with the content you share on social media. Your engagement team might love them, but they offer very little value. Simply measuring clicks, or site visits from social sources, without any other metrics to at least put those numbers into context is meaningless – and more than a little pointless. Many surveys and pieces are spotlighting these shortcomings.

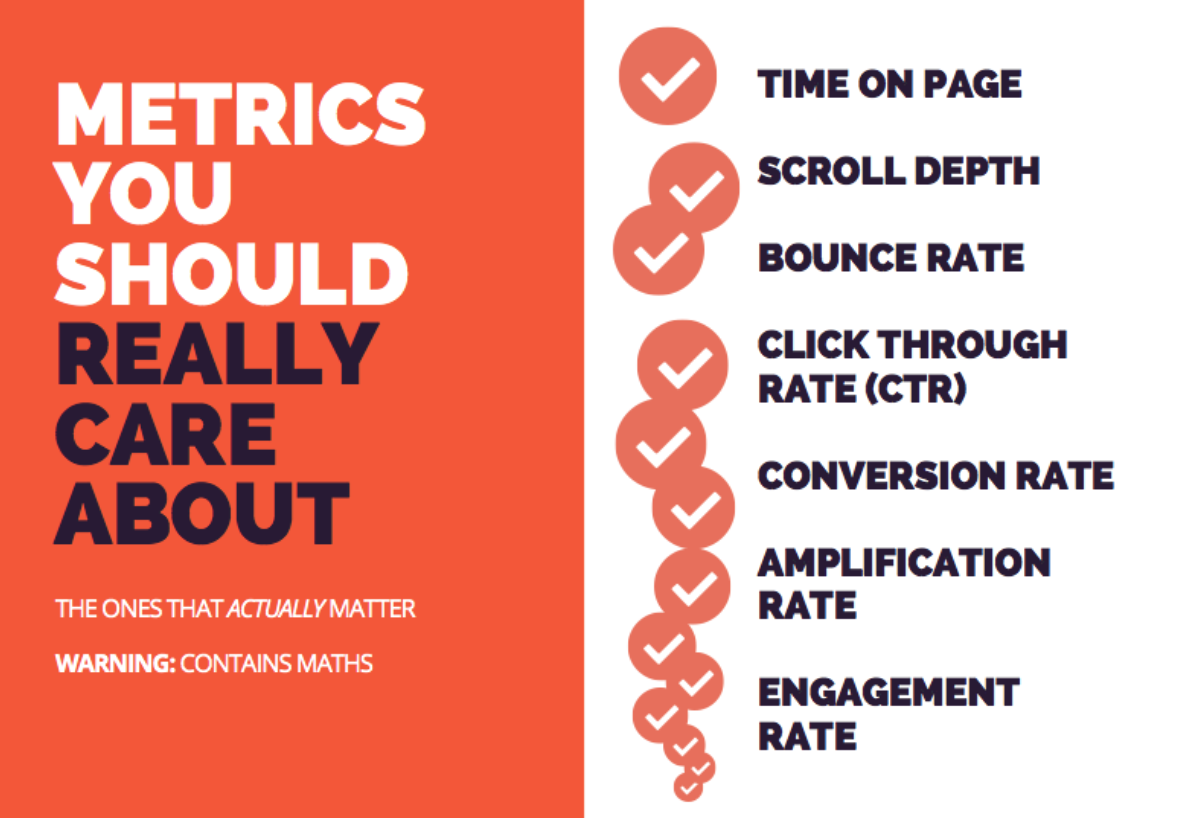
Here are the metrics that you should be obsessed with:
- Time-on-page and scroll depth are both great indicators that you’ve grabbed your audience’s attention.
- Bounce rate can be a little trickier to decipher; a high bounce rate doesn’t necessarily mean that people are disinterested in your content and jump ship as soon as possible, it could also mean that your piece serves its intended purpose, has answered a question and readers don’t need to hang around. The easiest way to spot the difference is to use bounce rate in conjunction with other engagement metrics, like…
- Conversion rate – the number of comments your post receives divided by the number of followers or page likes you have – that way you can tell if they were satisfied or quit before they got past the headline.
So what free tools can you use to get you all of this information?
Unfortunately, a lot of reporting is still manual unless you’re willing to pay a subscription, so you’ll have to export the data from Facebook and Twitter separately. Save yourself a bit of time with the rest of it by using Tweetdeck to schedule posts, link multiple accounts or set up teams so that anyone can share content at any time. It’s also useful for staying on top of coverage and monitoring what stories work well for competitors with similar audience demographics.
A tool worth considering if you’ve got some spare cash is Buzzsumo, which lets you see what your top performing content is across most of your social media channels, including Facebook, Twitter, LinkedIn and Pinterest.
This all matters because you need to know more than just how many people click on stuff your post. You need to know where your audience is and how they interact with your content if you’re going to get it read, shared, liked, maybe even loved. This matters because you should be engaging these people in a genuine and authentic way so that you build a loyal following for your brilliant content. And this matters because building a community of readers through social media is the best way to impact the metrics that your organization should be caring about, the ones that turn audiences into human beings and inform what you write and how you share it.
This post was adapted from a presentation given by Northeastern University journalism grad student Cat McGloin at The Student Media Innovation Conference on October 28, 2017.


