Before election day: a look at early voting trackers
In what has felt like the most toxic election in American history, the relatively new addition of early voting may be decisive in determining whether Hillary Clinton or Donald Trump will be heading to the White House. Currently 37 states and the District of Columbia allow some form of an early ballot.
Storybench took a look at how some journalists, scholars and organizations have been using early voting trackers to explain the landscape of this election through data.
The North Carolina battleground
North Carolina was the state where Republicans won by the smallest margin in 2012, and its 15 electoral votes might be the most important ones this year. It is also known for being good about releasing extensive data on elections, helping provide more information for the public and those building data visualizations!
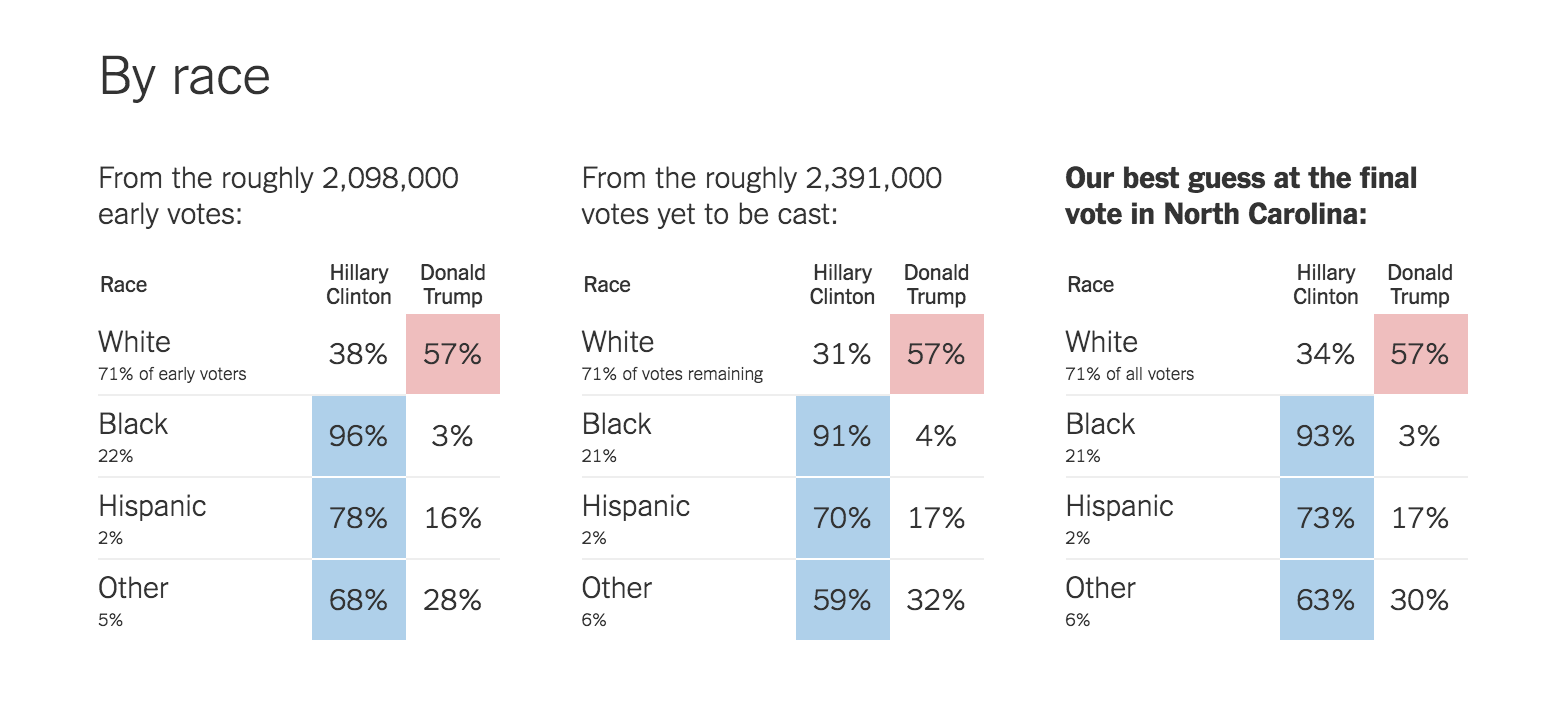
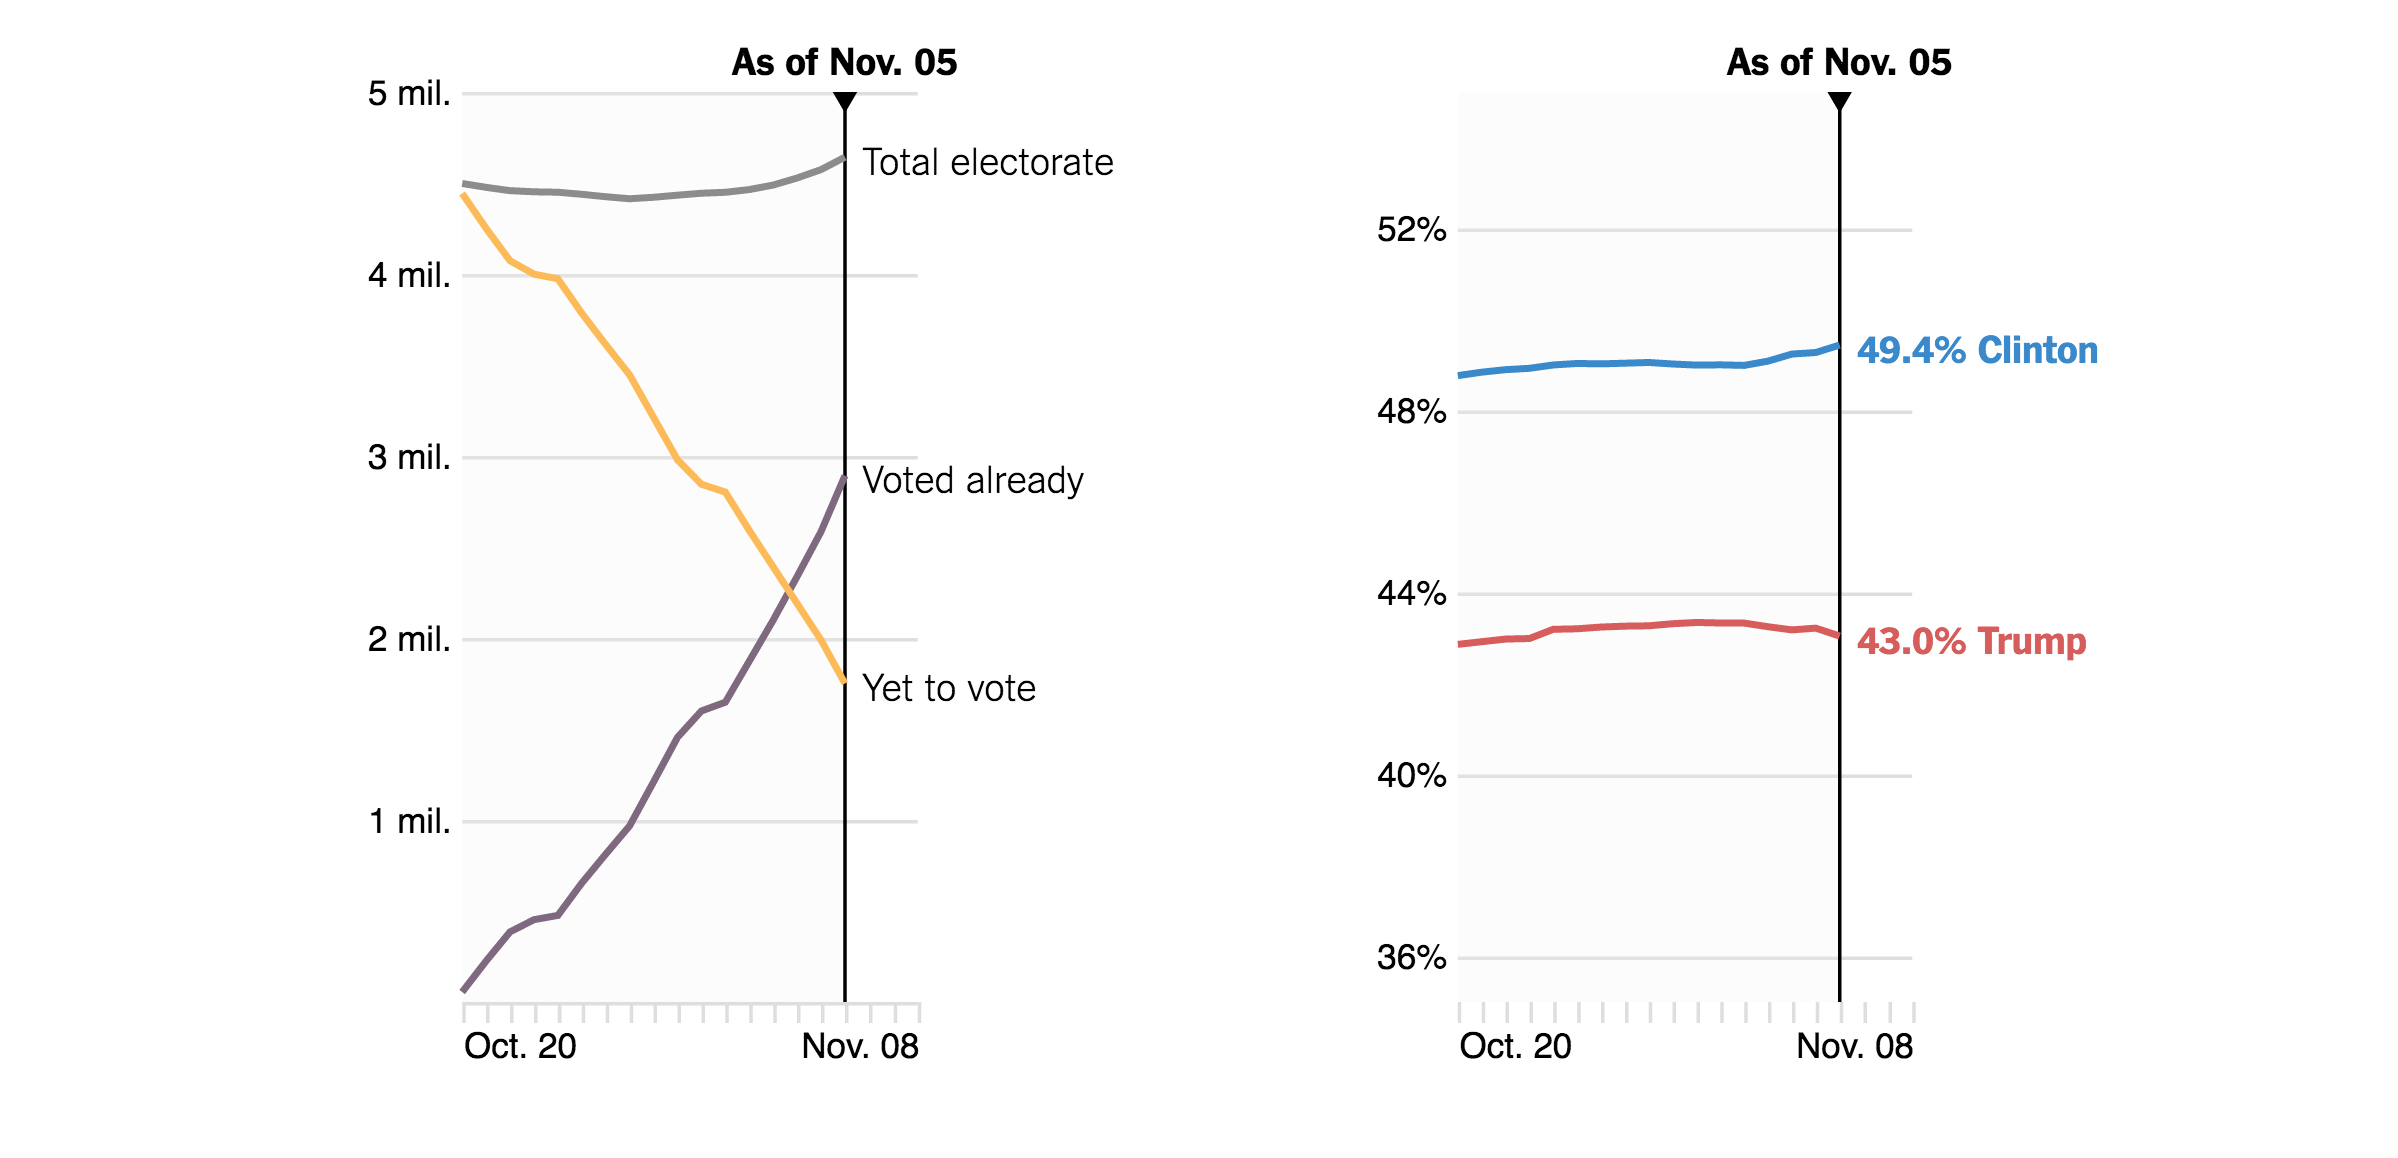
The New York Times is using the data released by the state’s board of elections to track early voting on North Carolina and predict the result of the election. The story is being updated daily and combines data from the early ballots and The Upshot/Siena College poll.

The Carolina Transparency Project created by the Civitas Institute, a North Carolina non-profit organization, built a very comprehensive interactive tracker on the same dataset. The tool allows users to navigate the data and shows vote counts per mail and in-person. It also offers a wide variety of breakdowns, including the option of filtering the data by county.
The landscape in Texas
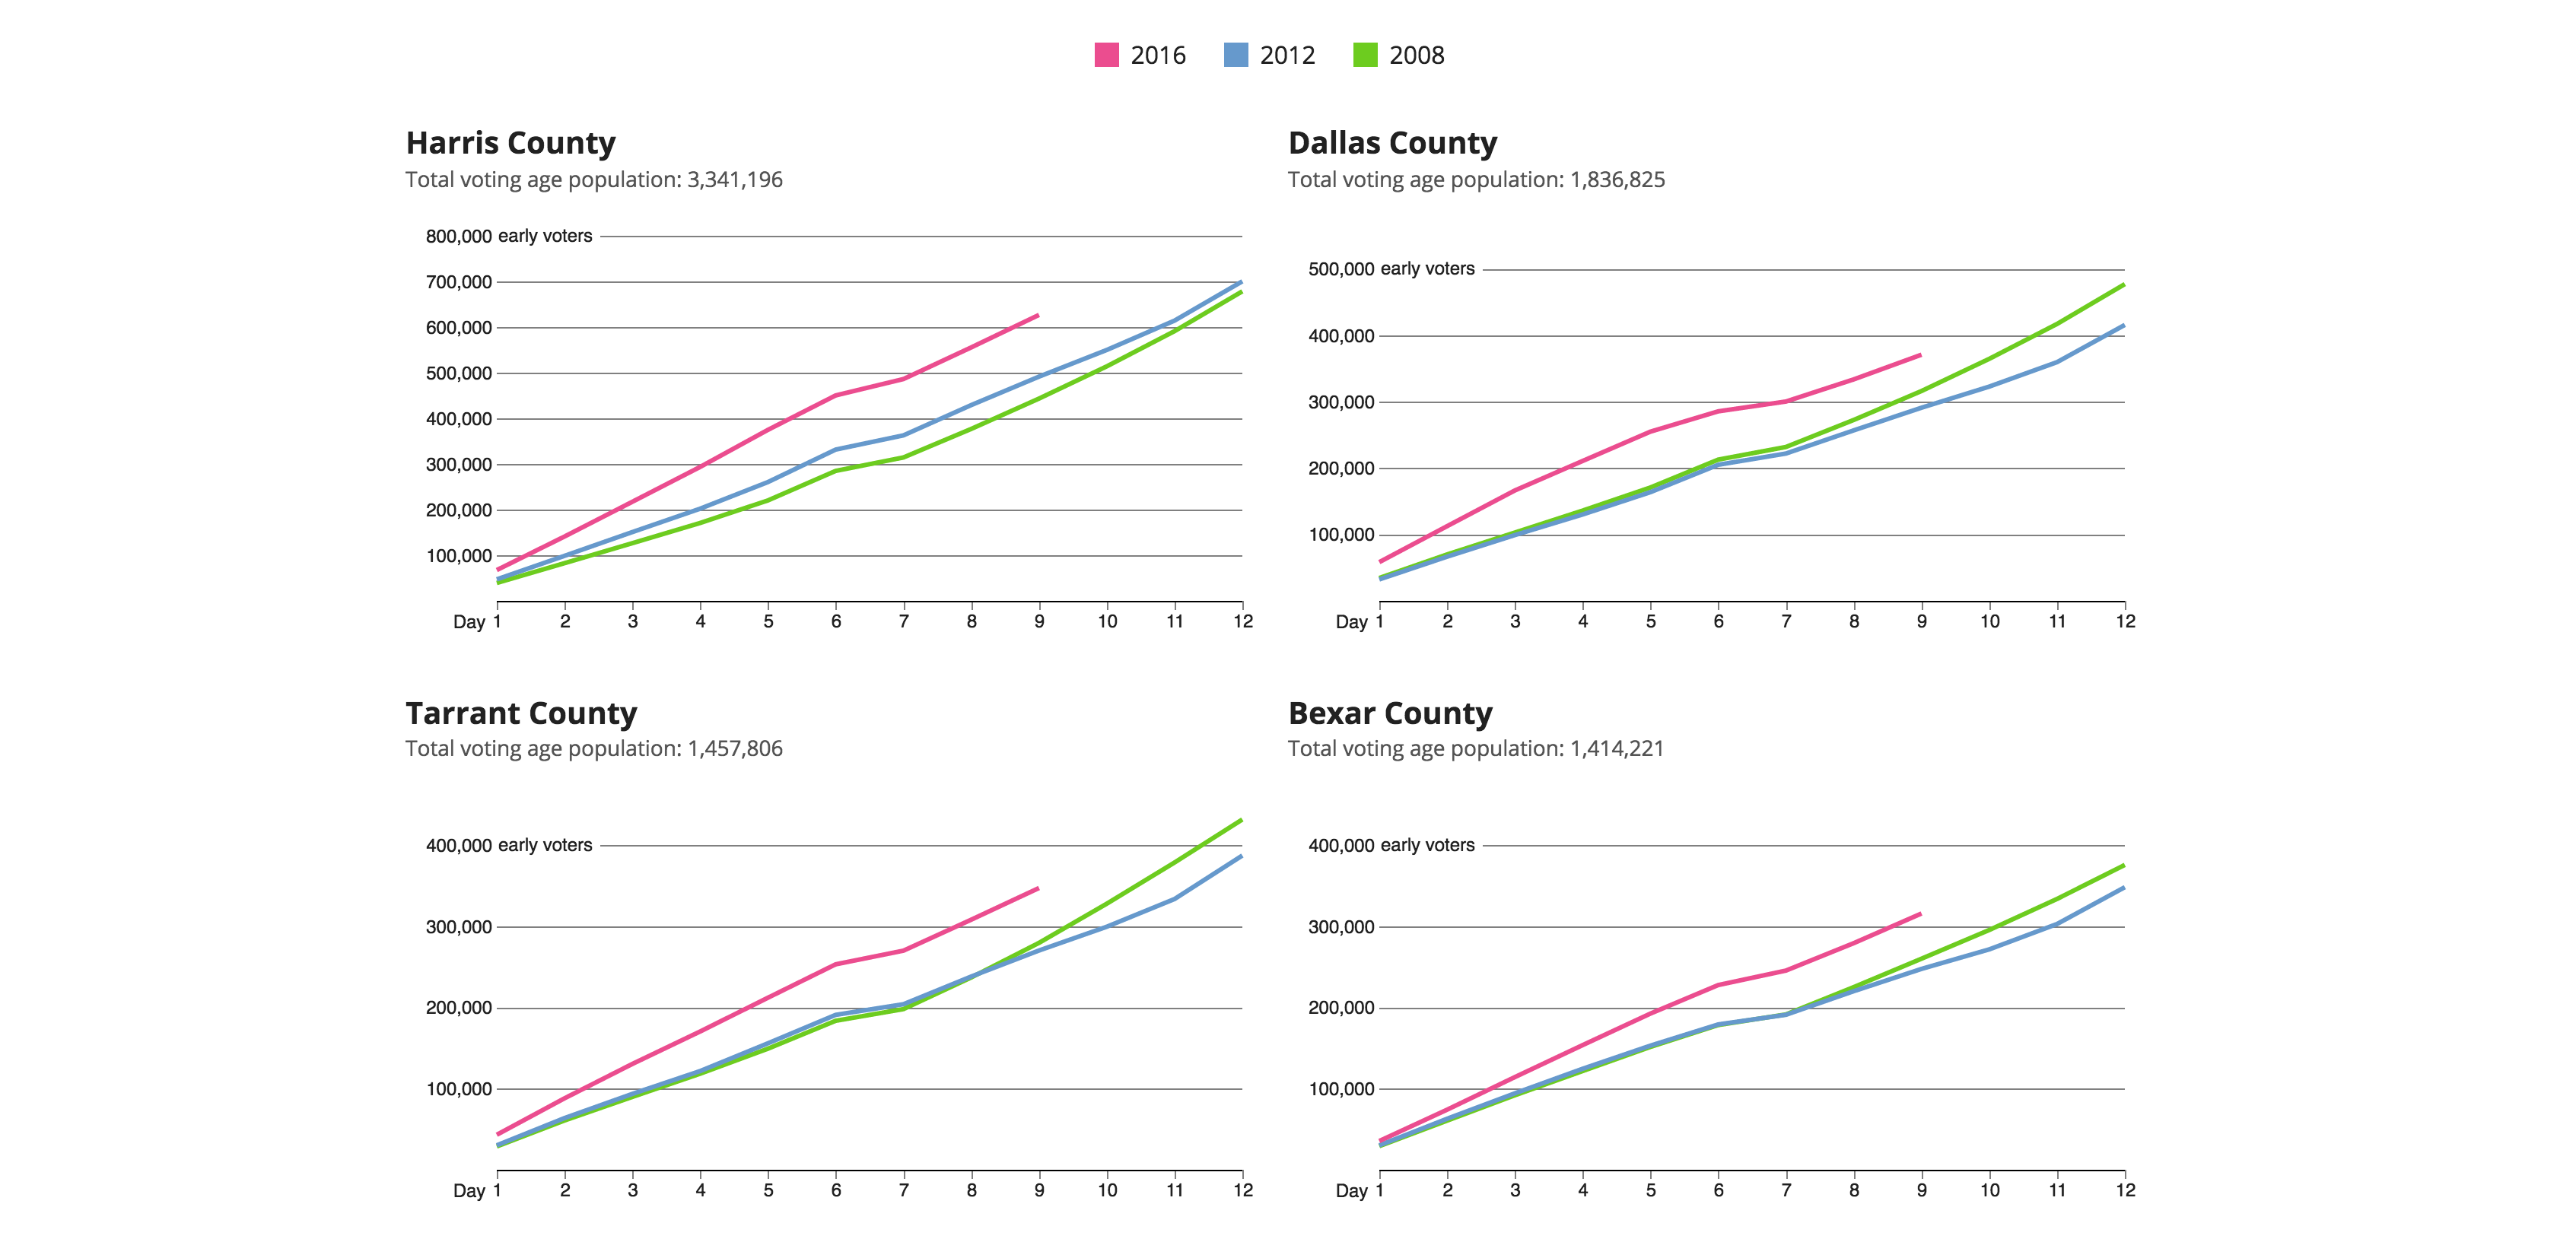
For years now The Texas Tribune has been working with early voting data released by the State of Texas. For the 2016, the graphics team put together a D3-based tracker for the ten largest counties with the data released daily by the Secretary of State. The Tribune charts also show the data for 2008 and 2012 for context.
Storybench recently spoke to Annie Daniel, a journalist at The Texas Tribune who developed the tool.
An absentee election
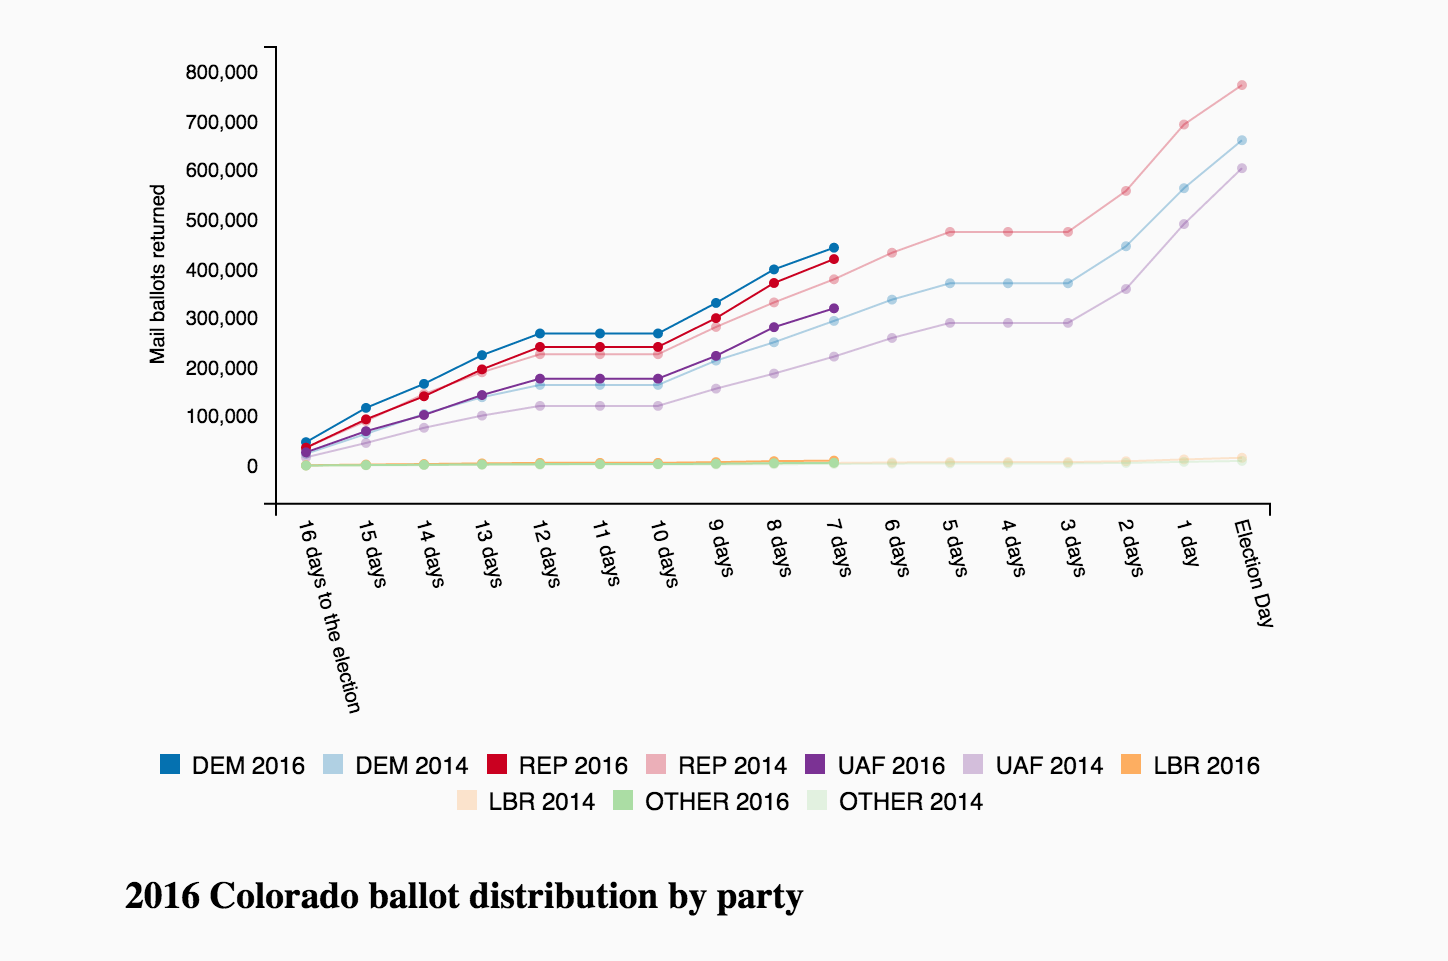
The Denver Post is tracking the first all-mail election in Colorado. Besides vote count, the paper also offers breakdowns by party distribution and counties, and a count of ballots received by the clerks. The story is being updated daily with data from Colorado’s Secretary of State.
A scholar’s approach
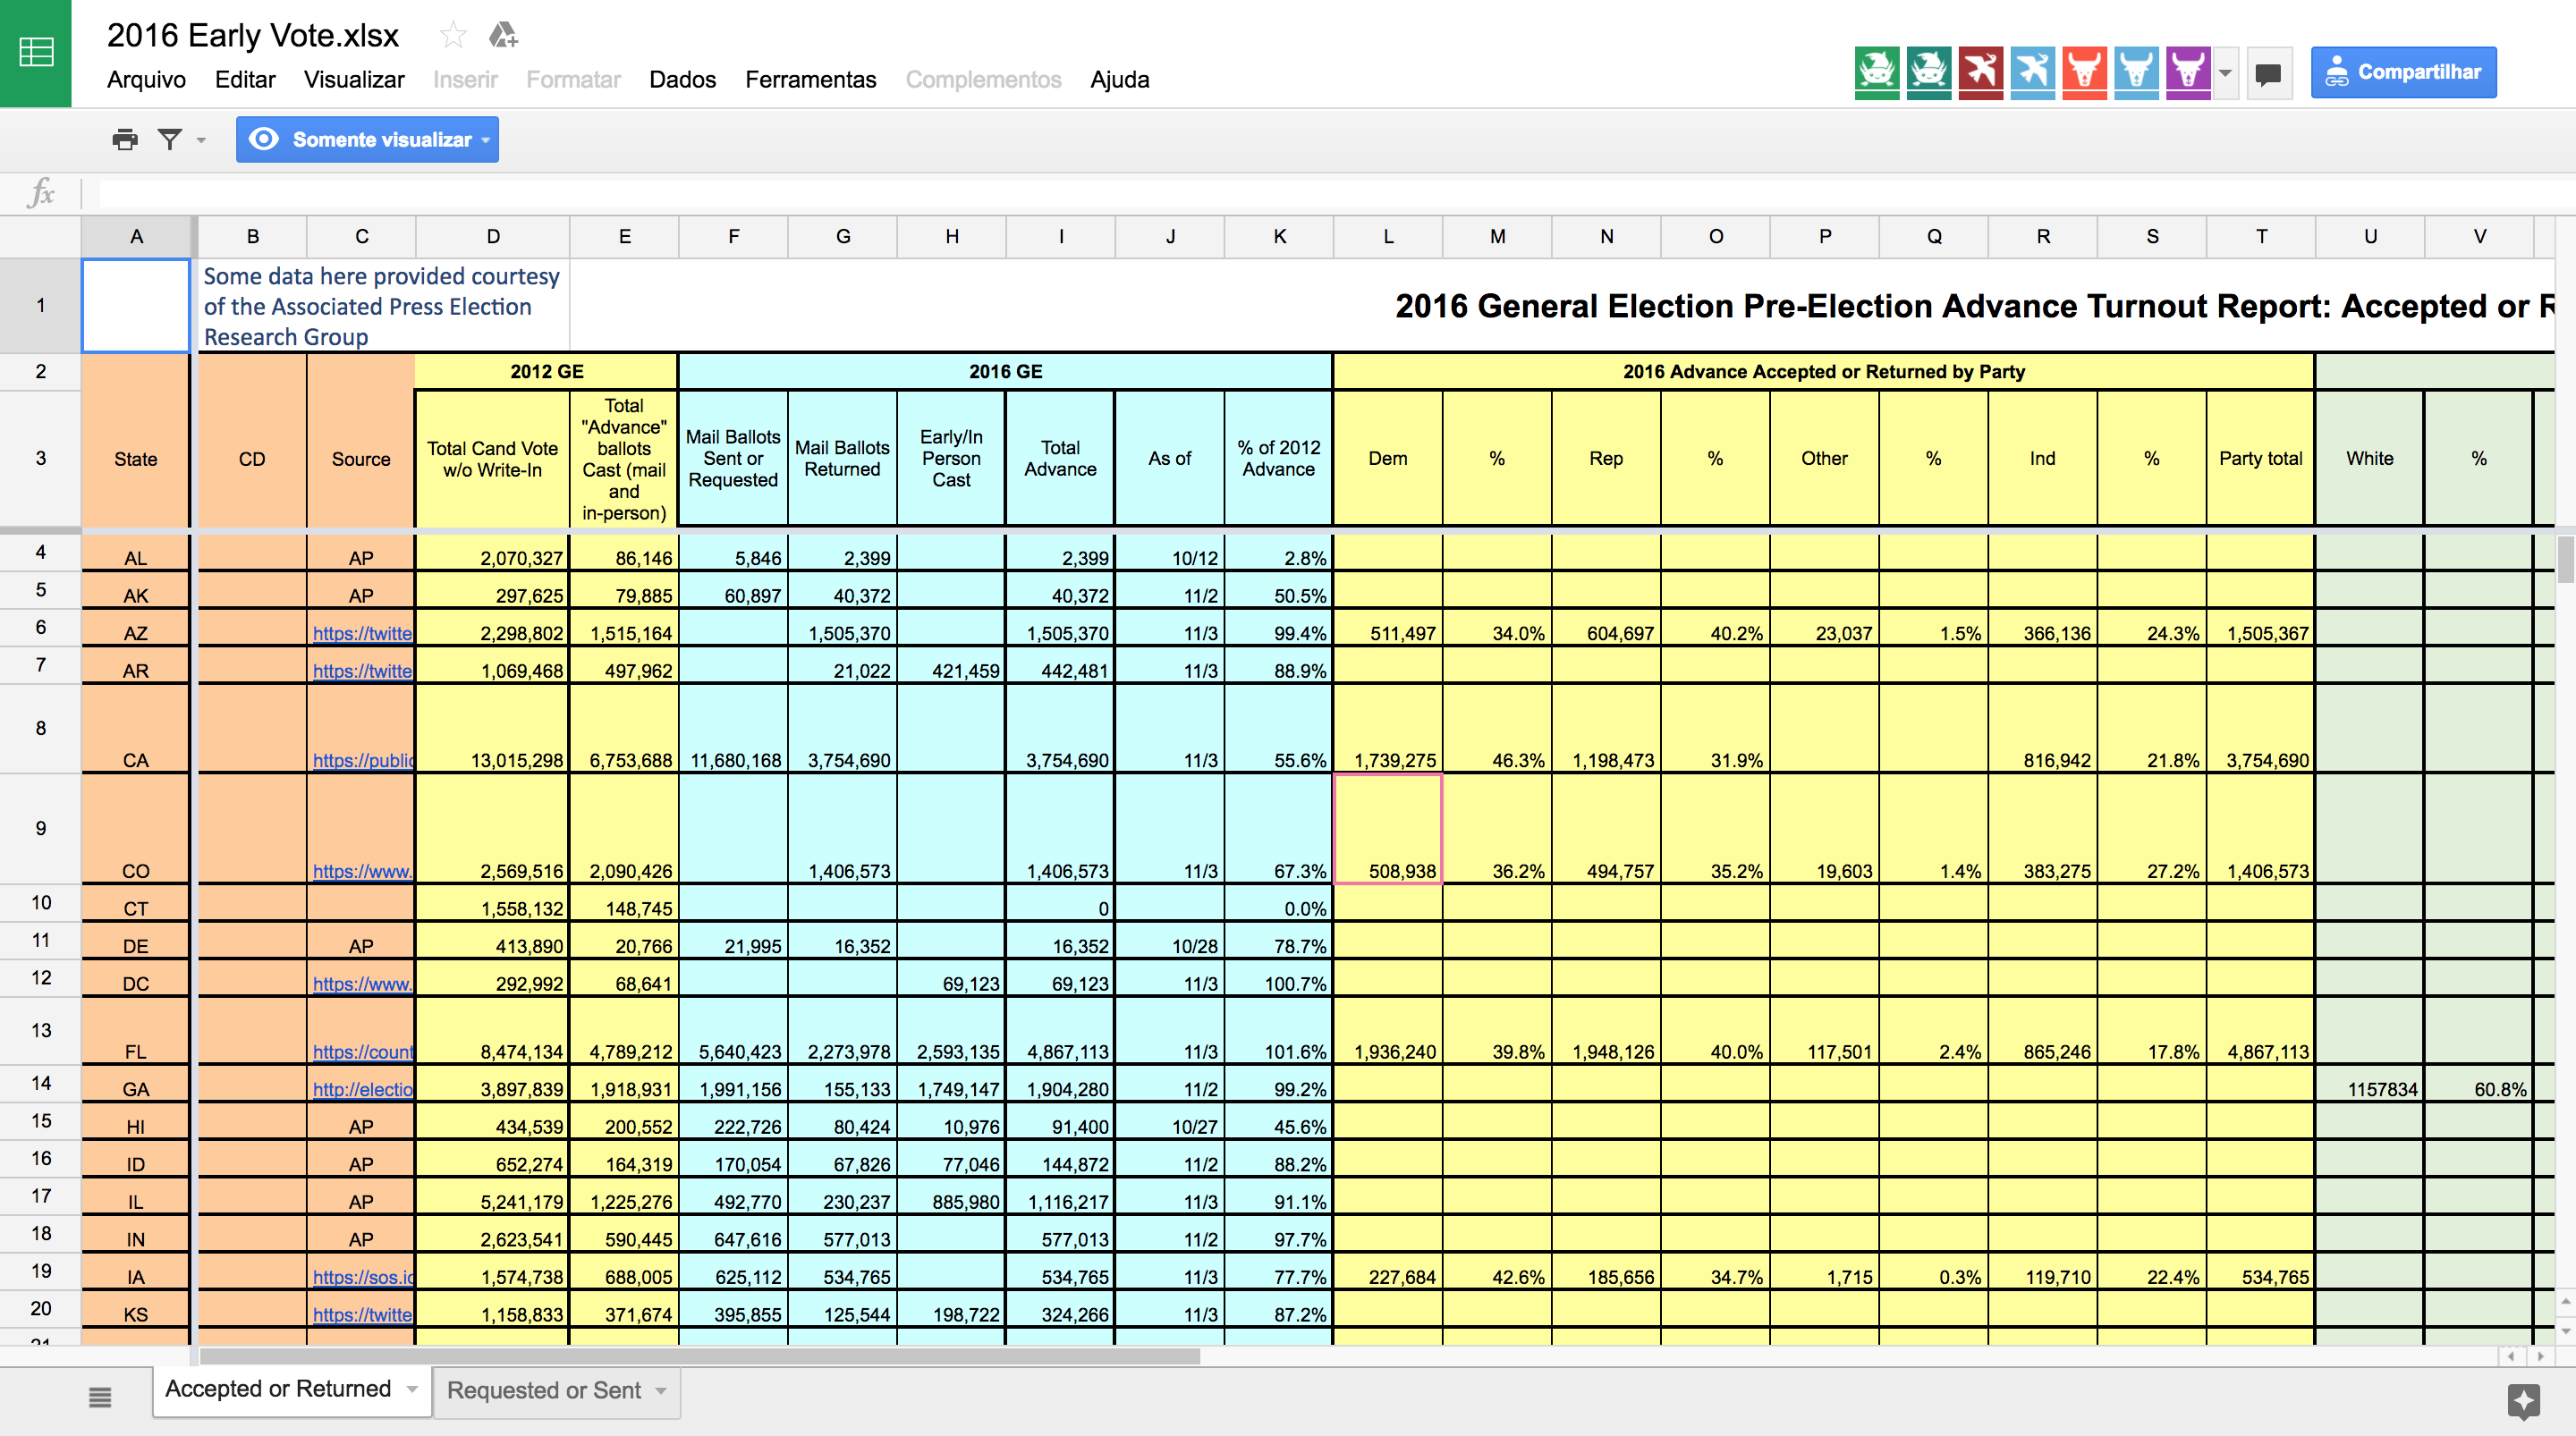
The United States Election Project provides one of the most complete databases on early ballots. Michael P. McDonald, an associate professor of political science at the University of Florida, runs the website and writes the analysis. With data collected from individual states and The Associated Press, he also blogs for the Huffington Post and tweets his analysis of the data.
- SXSW: ‘Excel is okay’ and other tweet-size insights for data journalists and news nerds - March 17, 2018
- NICAR: Data stories from last year that you could be doing in your newsroom - March 13, 2018
- How to scrape Reddit with Python - March 12, 2018
