How to build a bubble chart of individuals mentioned in the Mueller report
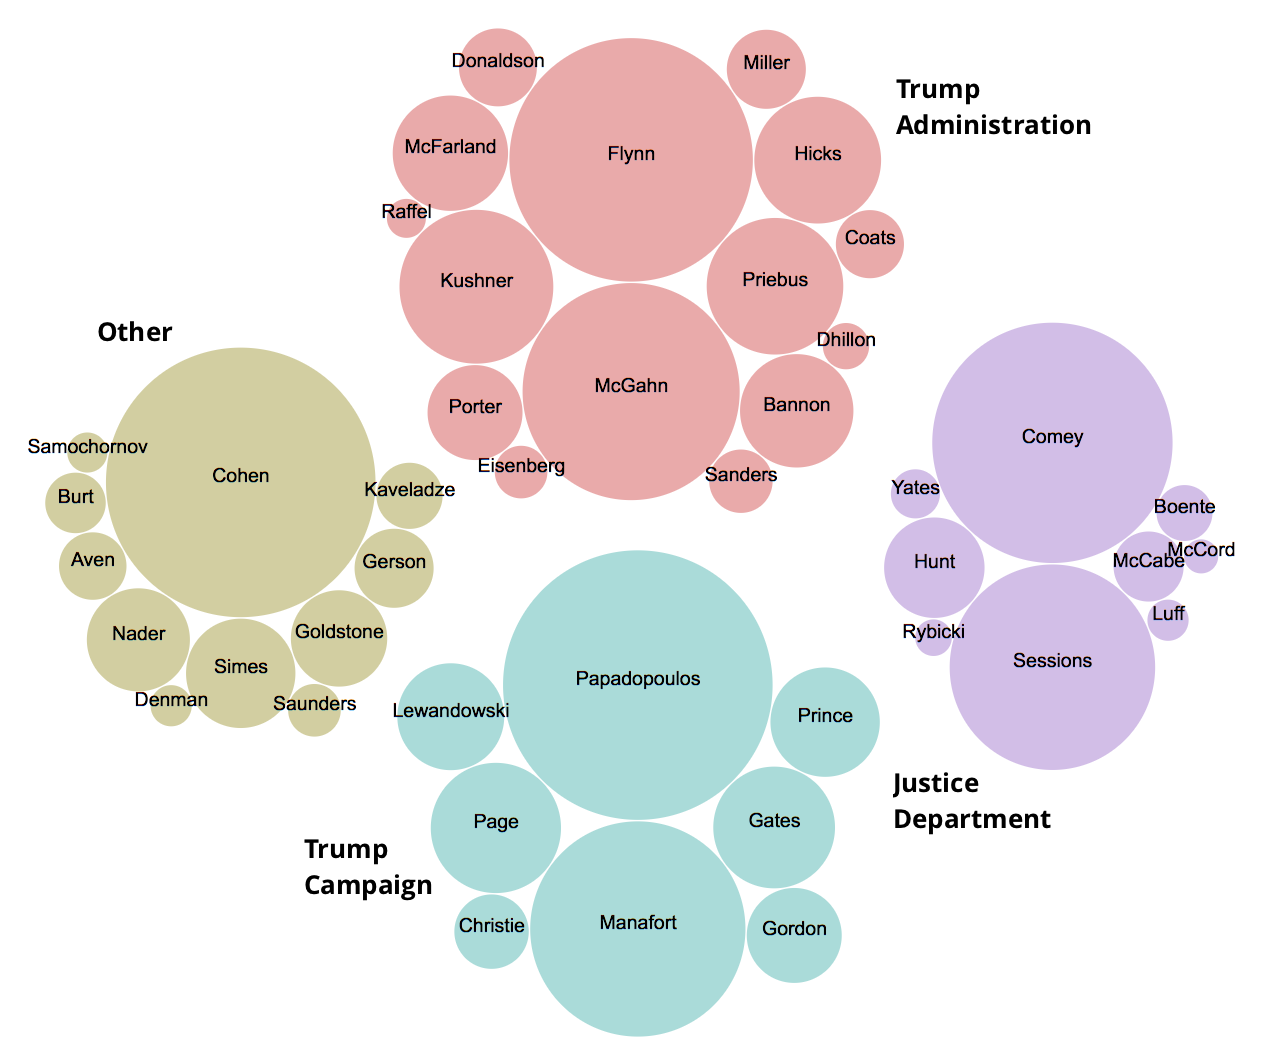
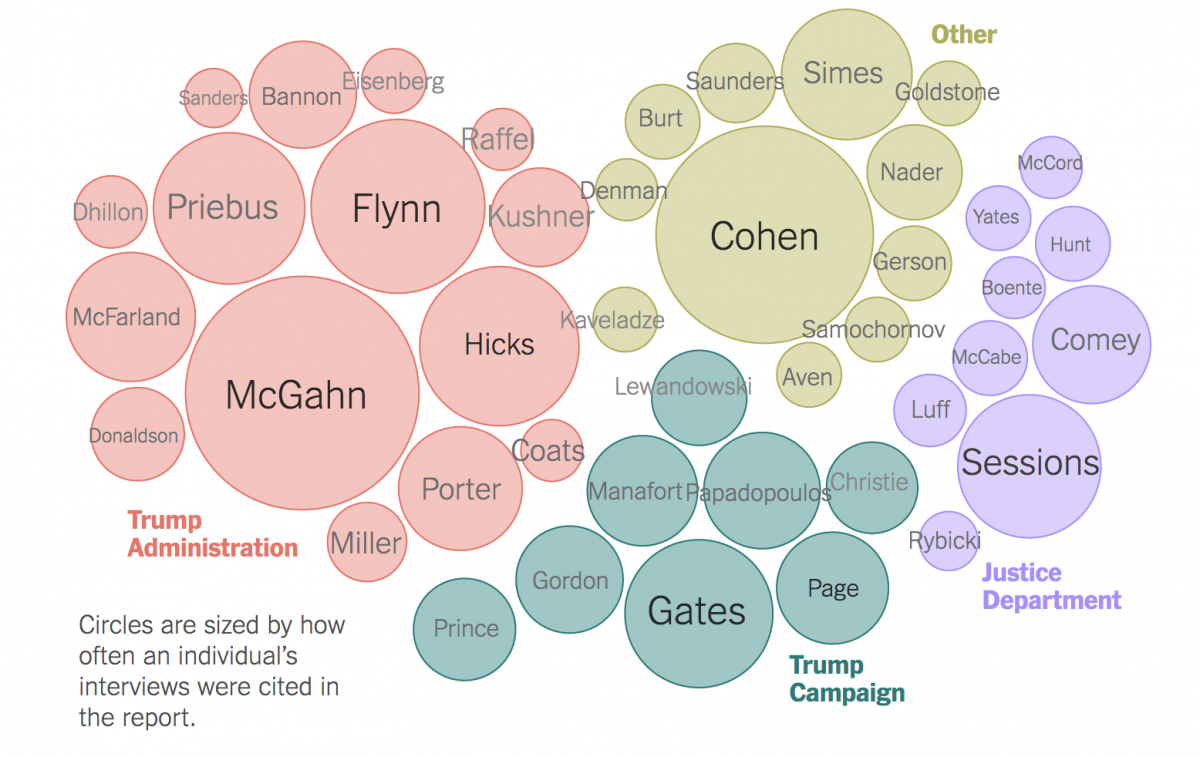
When the redacted Mueller report was released last week, journalists across the country scrambled to read through and analyze the document. Data scientists and information designers were hard at work, too, exploring the text and visualizing relationships and patterns. The New York Times published a compelling bubble chart that laid out which witnesses the report had relied on most. We attempted to replicate it.
This tutorial will walk you through ingesting the report in R, searching for a set of names, storing their frequencies and grouping in a table, and then visualizing the whole thing using Raw Graphs. To get started with R Studio read our tutorial. Our final version can be seen at top.
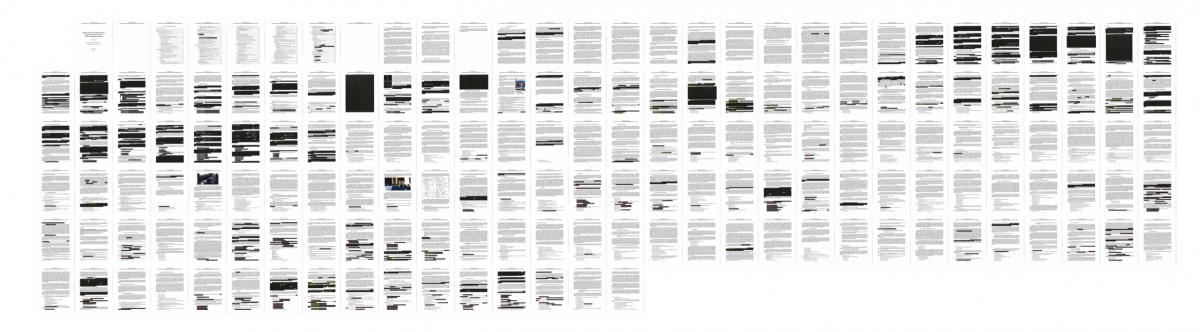
Tips: If you’re interested in building the image below, check out this tutorial from Nathan Yau of Flowing Data. And Garrick Aden-Buie has a cool tutorial for laying out the report with highlighted names.
Pulling in the report
In R Studio, we’ll load a few packages and then pull in a PDF of the Mueller report that Washington Post data editor Steven Rich shared on Twitter. Importantly, it was searchable.
library(dplyr)
library(pdftools)
library(stringr)

mueller_report_txt <- pdf_text("https://assets.documentcloud.org/documents/5955210/Redacted-Mueller-Report.pdf")
Search for Trump associates
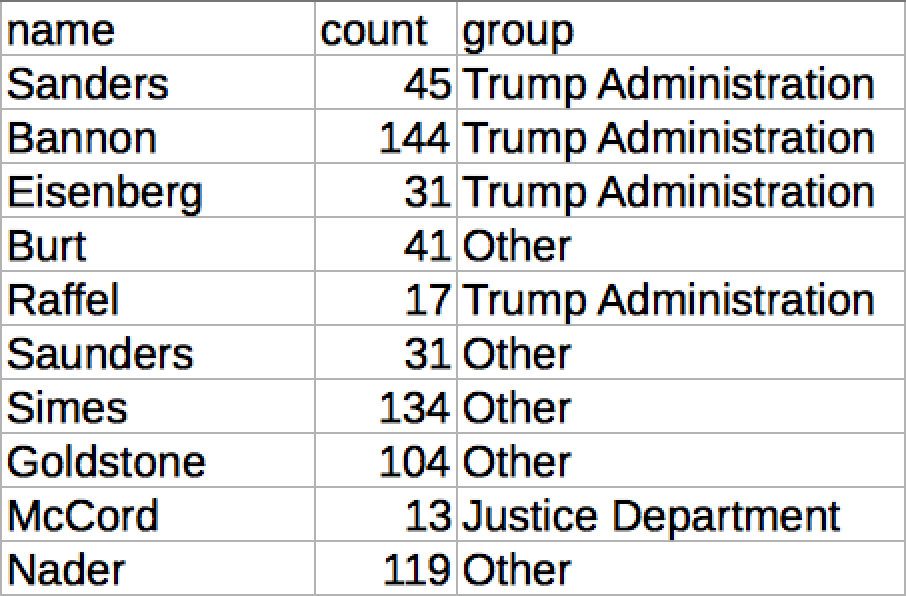
Next, we’ll build a table with the names and number of mentions. We’ll use the stringr package to count the number of mentions using str_count() and adding all those mentions together by pairing that function with sum() and place those in the second column using ncol=2, byrow=TRUE.
Finally, we’ll slap on some column names with colnames(names) <- c(“name”,”count”) and then view the table by calling names.
# Build a table

names <- matrix(c("Sanders", sum(str_count(mueller_report_txt, "Sanders")),
                  "Bannon", sum(str_count(mueller_report_txt, "Bannon")),
                  "Eisenberg",sum(str_count(mueller_report_txt, "Eisenberg")),
                  "Burt",sum(str_count(mueller_report_txt, "Burt")),
                  "Raffel",sum(str_count(mueller_report_txt, "Raffel")),
                  "Saunders",sum(str_count(mueller_report_txt, "Saunders")),
                  "Simes",sum(str_count(mueller_report_txt, "Simes")),
                  "Goldstone",sum(str_count(mueller_report_txt, "Goldstone")),
                  "McCord",sum(str_count(mueller_report_txt, "McCord")),
                  "Nader",sum(str_count(mueller_report_txt, "Nader")),
                  "Denman",sum(str_count(mueller_report_txt, "Denman")),
                  "Flynn",sum(str_count(mueller_report_txt, "Flynn")),
                  "Priebus",sum(str_count(mueller_report_txt, "Priebus")),
                  "Dhillon",sum(str_count(mueller_report_txt, "Dhillon")),
                  "Kushner",sum(str_count(mueller_report_txt, "Kushner")),
                  "Yates",sum(str_count(mueller_report_txt, "Yates")),
                  "Cohen",sum(str_count(mueller_report_txt, "Cohen")),
                  "Hunt",sum(str_count(mueller_report_txt, "Hunt")),
                  "Gerson",sum(str_count(mueller_report_txt, "Gerson")),
                  "Boente",sum(str_count(mueller_report_txt, "Boente")),
                  "McFarland",sum(str_count(mueller_report_txt, "McFarland")),
                  "Kaveladze",sum(str_count(mueller_report_txt, "Kaveladze")),
                  "Samochornov",sum(str_count(mueller_report_txt, "Samochornov")),
                  "Comey",sum(str_count(mueller_report_txt, "Comey|Corney")),
                  "Hicks",sum(str_count(mueller_report_txt, "Hicks")),
                  "McCabe",sum(str_count(mueller_report_txt, "McCabe")),
                  "Aven",sum(str_count(mueller_report_txt, "Aven")),
                  "Lewandowski",sum(str_count(mueller_report_txt, "Lewandowski")),
                  "McGahn",sum(str_count(mueller_report_txt, "McGahn")),
                  "Luff",sum(str_count(mueller_report_txt, "Luff")),
                  "Donaldson",sum(str_count(mueller_report_txt, "Donaldson")),
                  "Coats",sum(str_count(mueller_report_txt, "Coats")),
                  "Sessions",sum(str_count(mueller_report_txt, "Sessions")),
                  "Christie",sum(str_count(mueller_report_txt, "Christie")),
                  "Porter",sum(str_count(mueller_report_txt, "Porter")),
                  "Manafort",sum(str_count(mueller_report_txt, "Manafort")),
                  "Papadopoulos",sum(str_count(mueller_report_txt, "Cohen")),
                  "Rybicki",sum(str_count(mueller_report_txt, "Rybicki")),
                  "Miller",sum(str_count(mueller_report_txt, "Miller")),
                  "Gordon",sum(str_count(mueller_report_txt, "Gordon")),
                  "Page",sum(str_count(mueller_report_txt, "Page")),
                  "Gates",sum(str_count(mueller_report_txt, "Gates")),
                  "Prince",sum(str_count(mueller_report_txt, "Prince"))
                ), ncol=2, byrow=TRUE)

colnames(names) <- c("name","count")

names
Assign a category using case_when()
While likely not the fastest way to do this, we can use case_when() to assign categories to the names. First, we have to convert the table into a tidy format after which we can use mutate() and the case_when() functions to add a new column with the category each name belongs in.
# Change to tidy format
namestidy <- as_tibble(names)
namestidy

# Add column with grouping
namestidy <- namestidy %>%
  mutate(group = dplyr::case_when(
    name == "Sanders" ~ "Trump Administration",
    name == "Bannon" ~ "Trump Administration",
    name == "Eisenberg" ~ "Trump Administration",
    name == "Burt" ~ "Other",
    name == "Raffel" ~ "Trump Administration",
    name == "Saunders" ~ "Other",
    name == "Simes" ~ "Other",
    name == "Goldstone" ~ "Other",
    name == "McCord" ~ "Justice Department",
    name == "Nader" ~ "Other",
    name == "Denman" ~ "Other",
    name == "Flynn" ~ "Trump Administration",
    name == "Priebus" ~ "Trump Administration",
    name == "Dhillon" ~ "Trump Administration",
    name == "Kushner" ~ "Trump Administration",
    name == "Yates" ~ "Justice Department",
    name == "Cohen" ~ "Other",
    name == "Hunt" ~ "Justice Department",
    name == "Gerson" ~ "Other",
    name == "Boente" ~ "Justice Department",
    name == "McFarland" ~ "Trump Administration",
    name == "Kaveladze" ~ "Other",
    name == "Samochornov" ~ "Other",
    name == "Comey" ~ "Justice Department",
    name == "Hicks" ~ "Trump Administration",
    name == "McCabe" ~ "Justice Department",
    name == "Aven" ~ "Other",
    name == "Lewandowski" ~ "Trump Campaign",
    name == "McGahn" ~ "Trump Administration",
    name == "Luff" ~ "Justice Department",
    name == "Donaldson" ~ "Trump Administration",
    name == "Coats" ~ "Trump Administration",
    name == "Sessions" ~ "Justice Department",
    name == "Christie" ~ "Trump Campaign",
    name == "Porter" ~ "Trump Administration",name == "Manafort" ~ "Trump Campaign",
    name == "Papadopoulos" ~ "Trump Campaign",name == "Rybicki" ~ "Justice Department",
    name == "Miller" ~ "Trump Administration",name == "Gordon" ~ "Trump Campaign",
    name == "Page" ~ "Trump Campaign",name == "Gates" ~ "Trump Campaign",
    name == "Prince" ~ "Trump Campaign"
  ))
Then, we can write the data frame to a CSV using write.csv(namestidy, “mueller-names.csv”). Nice! Download that here.
*Note: The New York Times piece has slightly different numbers since they are counting the numbers of interviews with these individuals cited in the report. We’re just looking for raw mentions.
Drop the CSV into Raw Graphs
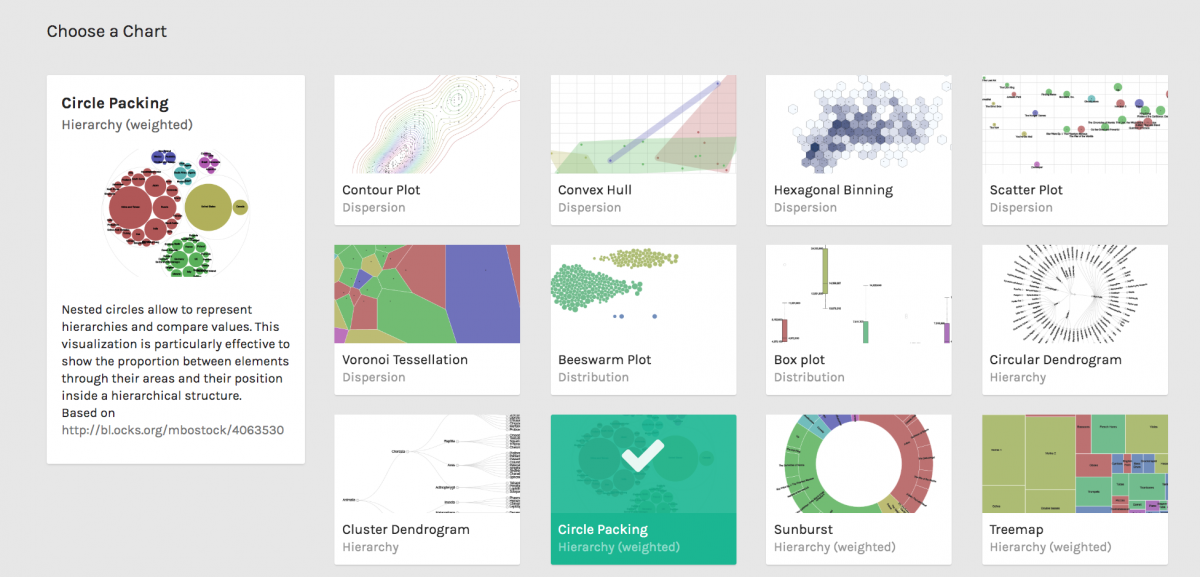
I love Raw Graphs from the Politecnico de Milano. It lets you drop in data copied from a spreadsheet and build several fun Javascript D3-inspired visualizations. Let’s drop in our data and select “Circle Packing.”
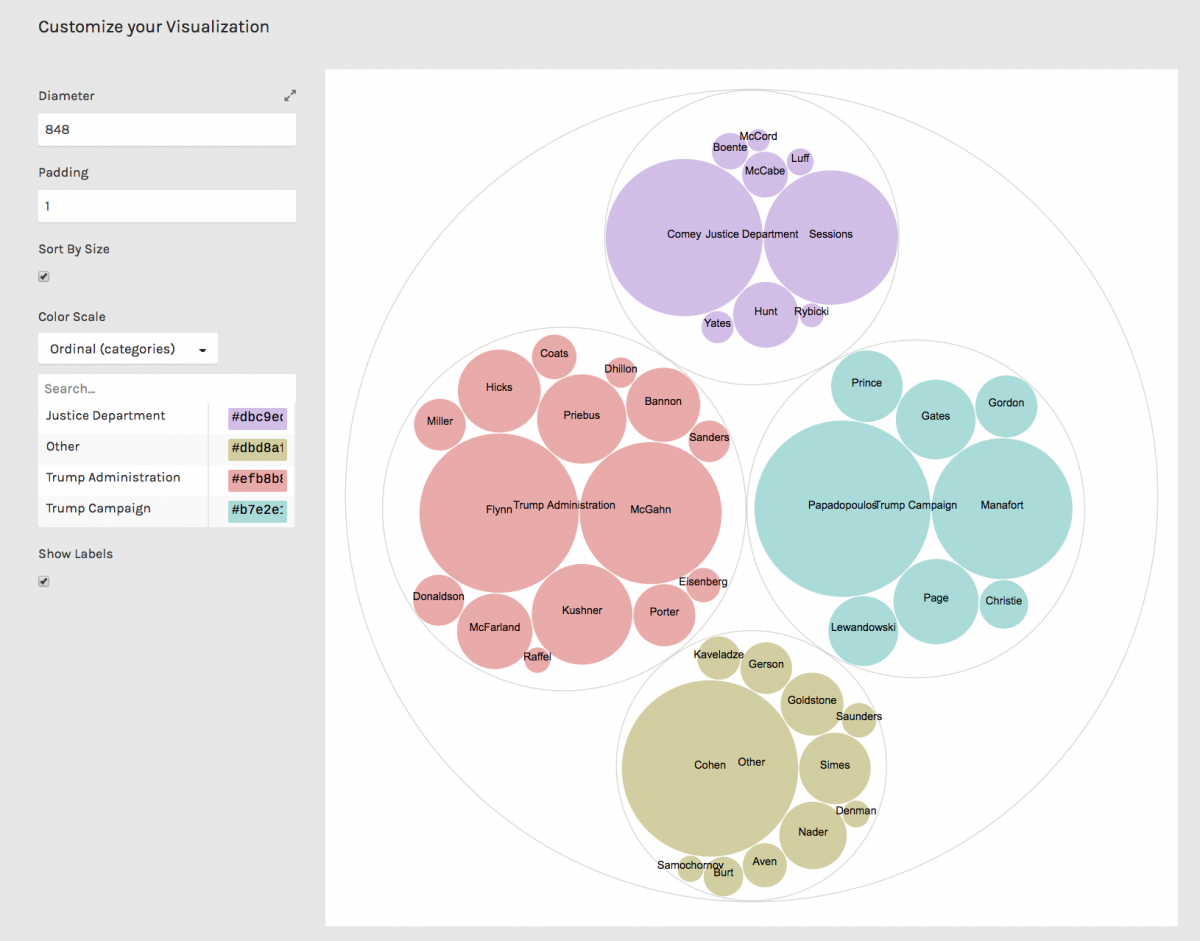
After putting group and name under “hierarchy,” count under “size,” and group under “color,” we get the following. I’ve changed the colors by clicking their hex codes.
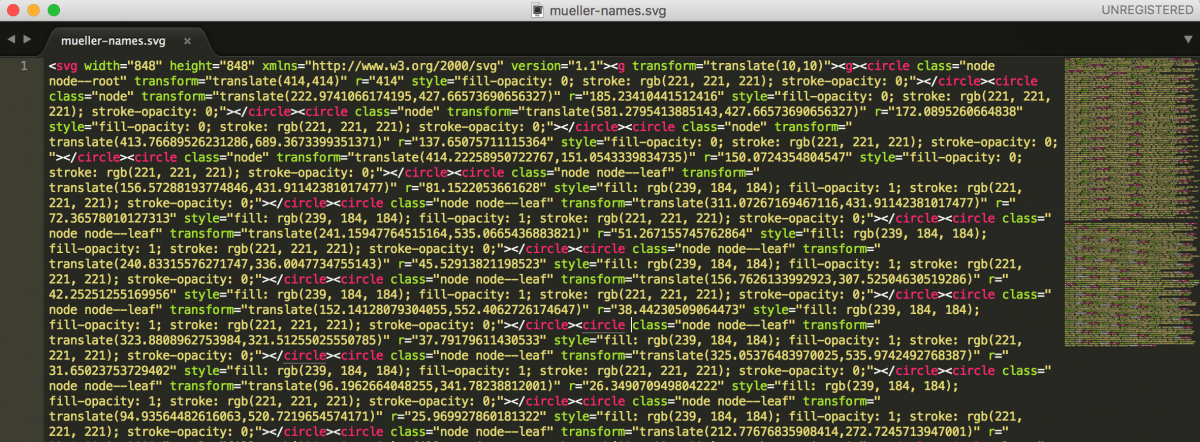
Nice! Let’s download as an SVG file.
Edit the SVG code
We’re getting close. Now for some design. Let’s open the SVG code in a text editor like Sublime Text.
Using “Find and Replace,” we can set the fill-opacity of the grey lines to 0, change the font-size to 13 and remove the grouping labels like “Other.” (Hack: I added rotate(-90) to all of the names so I could flip the graphic 90 degrees and approximate the layout of the Times.)
I opened that SVG file in a browser and took a screengrab, bringing it into Adobe Illustrator for some final touches like adding the grouping labels back in. Pretty close, huh?

Full code here:
library(dplyr)
library(pdftools)
library(stringr)

mueller_report_txt <- pdf_text("https://assets.documentcloud.org/documents/5955210/Redacted-Mueller-Report.pdf")

# Build a table with names and mentions of each
names <- matrix(c("Sanders", sum(str_count(mueller_report_txt, "Sanders")),
                  "Bannon", sum(str_count(mueller_report_txt, "Bannon")),
                  "Eisenberg",sum(str_count(mueller_report_txt, "Eisenberg")),
                  "Burt",sum(str_count(mueller_report_txt, "Burt")),
                  "Raffel",sum(str_count(mueller_report_txt, "Raffel")),
                  "Saunders",sum(str_count(mueller_report_txt, "Saunders")),
                  "Simes",sum(str_count(mueller_report_txt, "Simes")),
                  "Goldstone",sum(str_count(mueller_report_txt, "Goldstone")),
                  "McCord",sum(str_count(mueller_report_txt, "McCord")),
                  "Nader",sum(str_count(mueller_report_txt, "Nader")),
                  "Denman",sum(str_count(mueller_report_txt, "Denman")),
                  "Flynn",sum(str_count(mueller_report_txt, "Flynn")),
                  "Priebus",sum(str_count(mueller_report_txt, "Priebus")),
                  "Dhillon",sum(str_count(mueller_report_txt, "Dhillon")),
                  "Kushner",sum(str_count(mueller_report_txt, "Kushner")),
                  "Yates",sum(str_count(mueller_report_txt, "Yates")),
                  "Cohen",sum(str_count(mueller_report_txt, "Cohen")),
                  "Hunt",sum(str_count(mueller_report_txt, "Hunt")),
                  "Gerson",sum(str_count(mueller_report_txt, "Gerson")),
                  "Boente",sum(str_count(mueller_report_txt, "Boente")),
                  "McFarland",sum(str_count(mueller_report_txt, "McFarland")),
                  "Kaveladze",sum(str_count(mueller_report_txt, "Kaveladze")),
                  "Samochornov",sum(str_count(mueller_report_txt, "Samochornov")),
                  "Comey",sum(str_count(mueller_report_txt, "Comey|Corney")),
                  "Hicks",sum(str_count(mueller_report_txt, "Hicks")),
                  "McCabe",sum(str_count(mueller_report_txt, "McCabe")),
                  "Aven",sum(str_count(mueller_report_txt, "Aven")),
                  "Lewandowski",sum(str_count(mueller_report_txt, "Lewandowski")),
                  "McGahn",sum(str_count(mueller_report_txt, "McGahn")),
                  "Luff",sum(str_count(mueller_report_txt, "Luff")),
                  "Donaldson",sum(str_count(mueller_report_txt, "Donaldson")),
                  "Coats",sum(str_count(mueller_report_txt, "Coats")),
                  "Sessions",sum(str_count(mueller_report_txt, "Sessions")),
                  "Christie",sum(str_count(mueller_report_txt, "Christie")),
                  "Porter",sum(str_count(mueller_report_txt, "Porter")),
                  "Manafort",sum(str_count(mueller_report_txt, "Manafort")),
                  "Papadopoulos",sum(str_count(mueller_report_txt, "Cohen")),
                  "Rybicki",sum(str_count(mueller_report_txt, "Rybicki")),
                  "Miller",sum(str_count(mueller_report_txt, "Miller")),
                  "Gordon",sum(str_count(mueller_report_txt, "Gordon")),
                  "Page",sum(str_count(mueller_report_txt, "Page")),
                  "Gates",sum(str_count(mueller_report_txt, "Gates")),
                  "Prince",sum(str_count(mueller_report_txt, "Prince"))
                ), ncol=2, byrow=TRUE)

colnames(names) <- c("name","count")

names

# Change to tidy format
namestidy <- as_tibble(names)
namestidy

# Add column with grouping
namestidy <- namestidy %>%
  mutate(group = dplyr::case_when(
    name == "Sanders" ~ "Trump Administration",
    name == "Bannon" ~ "Trump Administration",
    name == "Eisenberg" ~ "Trump Administration",
    name == "Burt" ~ "Other",
    name == "Raffel" ~ "Trump Administration",
    name == "Saunders" ~ "Other",
    name == "Simes" ~ "Other",
    name == "Goldstone" ~ "Other",
    name == "McCord" ~ "Justice Department",
    name == "Nader" ~ "Other",
    name == "Denman" ~ "Other",
    name == "Flynn" ~ "Trump Administration",
    name == "Priebus" ~ "Trump Administration",
    name == "Dhillon" ~ "Trump Administration",
    name == "Kushner" ~ "Trump Administration",
    name == "Yates" ~ "Justice Department",
    name == "Cohen" ~ "Other",
    name == "Hunt" ~ "Justice Department",
    name == "Gerson" ~ "Other",
    name == "Boente" ~ "Justice Department",
    name == "McFarland" ~ "Trump Administration",
    name == "Kaveladze" ~ "Other",
    name == "Samochornov" ~ "Other",
    name == "Comey" ~ "Justice Department",
    name == "Hicks" ~ "Trump Administration",
    name == "McCabe" ~ "Justice Department",
    name == "Aven" ~ "Other",
    name == "Lewandowski" ~ "Trump Campaign",
    name == "McGahn" ~ "Trump Administration",
    name == "Luff" ~ "Justice Department",
    name == "Donaldson" ~ "Trump Administration",
    name == "Coats" ~ "Trump Administration",
    name == "Sessions" ~ "Justice Department",
    name == "Christie" ~ "Trump Campaign",
    name == "Porter" ~ "Trump Administration",name == "Manafort" ~ "Trump Campaign",
    name == "Papadopoulos" ~ "Trump Campaign",name == "Rybicki" ~ "Justice Department",
    name == "Miller" ~ "Trump Administration",name == "Gordon" ~ "Trump Campaign",
    name == "Page" ~ "Trump Campaign",name == "Gates" ~ "Trump Campaign",
    name == "Prince" ~ "Trump Campaign"
  ))

#write.csv(namestidy, "mueller-names.csv")


