How to install R on a Jupyter notebook
This post walks through how to install R on a Jupyter notebook, load in data and build a visualization. Start by installing python using homebrew.
Install python
Open Terminal and enter the following commands.
$ brew install python
It should already be installed, in which case you’ll need to upgrade
$ brew upgrade python
Install jupyter
Next install the jupyter notebook
$ brew install jupyter
Install zmq
$ brew install zmq
Install the following R packages
These packages can be installed using R or RStudio. They are also found in the jupyter-install-pkgs.R file.
install.packages(c('rzmq','repr','IRkernel','IRdisplay'),
                 repos = c('http://irkernel.github.io/',
                           getOption('repos')),
                 type = 'source')
IRkernel::installspec(user = FALSE)
Launch jupyter notebooks
Open a new terminal window, enter the following commands.
$ jupyter notebook
This will launch the jupter notebook. You’ll see this in your Terminal:

The jupyter notebook will open in the browser

Click on the New icon in the upper right corner of the Jupyter notebook and select R.

Click on the Untitled text next to the Jupyter on the top of the notebook and rename the file something meaningful.

Using jupyter notebooks
The Jupyter notebooks combine code cells with markdown (just like RStudio Notebooks). I’ll start this notebook with a markdown title cell.

As you can see, this cell has markdown syntax highlighting. If I want to see how the cell will look after running it, hold down control + return (this is how to run a cell in Jupyter notebooks).

Run some R code
Enter the following code in the next cell and run it (either by using control + return or clicking Run)
# run this in jupyter notebook --------------------------------------------
# install packages
suppressPackageStartupMessages(library(tidyverse))
suppressPackageStartupMessages(library(magrittr))
suppressPackageStartupMessages(library(mosaic))
suppressPackageStartupMessages(library(tigerstats))
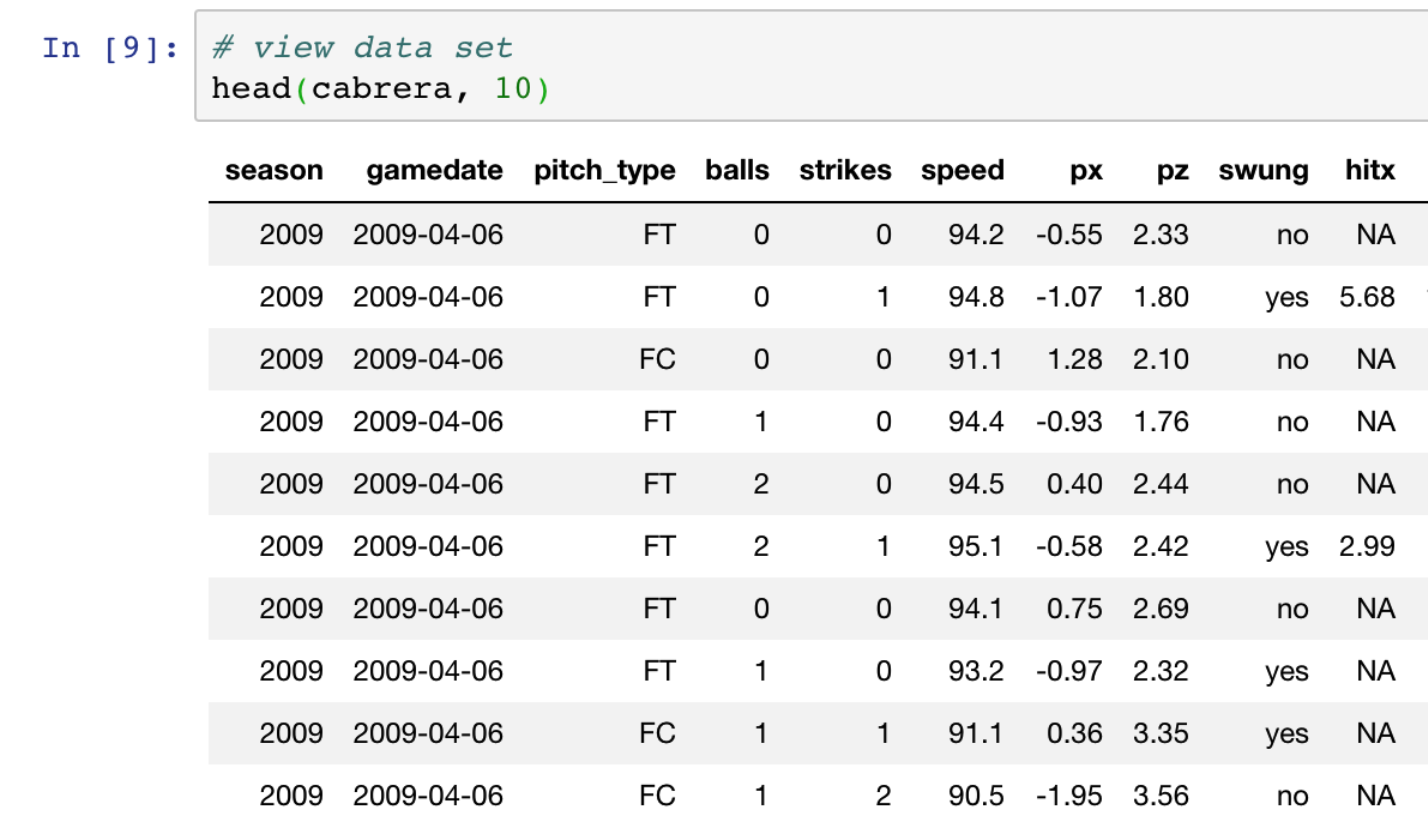
Let’s print a portion of a data frame to see what it looks like in Jupyter notebooks.
# get data set
cabrera <- tigerstats::cabrera

Tables look pretty in Jupyter!
Run ggplot in Jupyter
I’ll see how a ggplot2 visualization looks next. Enter the following commands into the next code cell (I turned off the warnings before and after the plot commands to get rid of all the excess output).
# turn off warnings for chart -----
options(warn=-1)
# plot spray chart
cabrera %>%
  ggplot2::ggplot(aes(x = hitx, y = hity)) +
  ggplot2::geom_point(aes(color = hit_outcome)) +
  ggplot2::coord_equal() +
  ggplot2::facet_wrap(~ season) +
  ggplot2::labs(
    title = "Spray Chart of Miguel Cabrera’s balls hit into play by season (2009-2012)",
    subtitle = "from tigerstats package")
# turn warnings back on -----
options(warn=-0)
The graph output is directly beneath the cell! Beautiful!

Download options
Under File > Download as I can see I have the option to save this file as a .ipynb (which is a JSON file), .md, .r, and many others.
Happy coding!
- Getting started with stringr for textual analysis in R - February 8, 2024
- How to calculate a rolling average in R - June 22, 2020
- Update: How to geocode a CSV of addresses in R - June 13, 2020


Hi,
I can get Bash and R kernels installed on my own version of Jupyter notebook. However, I also have a Jupyter notebook that is running on a server (Amazon Web Services c4.large Ubuntu EC2 instance).
I was able to get the Bash kernel into the Jupyter notebook running on this server, but can’t get the R kernel to install. Has anyone else been able to do this successfully? Is there a way to install the R kernel from the Jupyter notebook Terminal?
Thanks,
Nicole
Great job! Thanks for sharing.