How to build margin of victory election maps with Datawrapper
With the campaign for 2020 in full swing, it’s election map season. I was recently poking around Politico’s 2018 midterm election maps and thought I’d recreate their county-by-county Margin of victory election maps using Datawrapper.
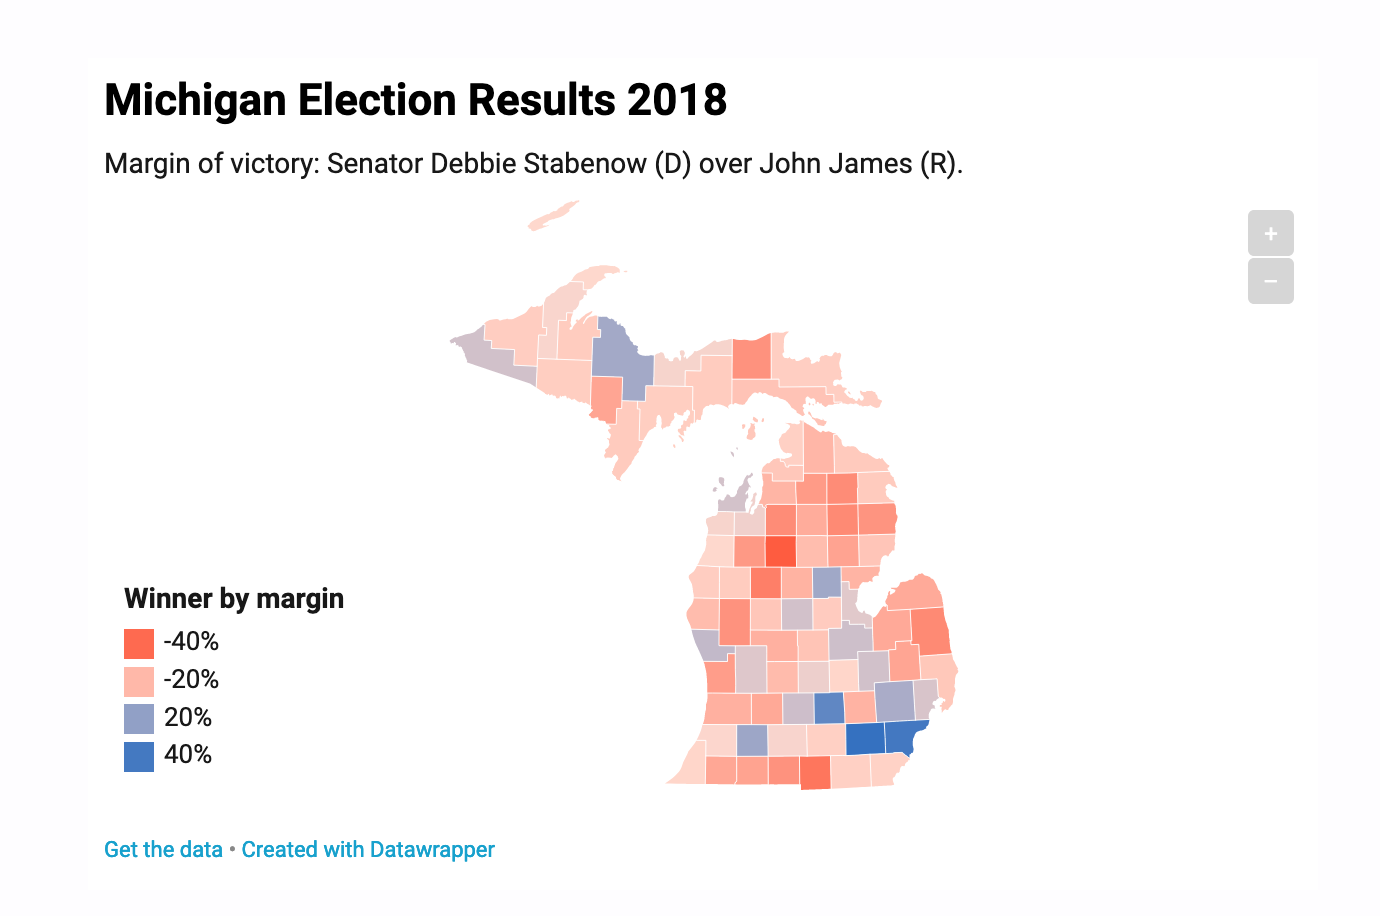
The following tutorial will create a map of Michigan’s counties with the results of the 2018 Debbie Stabenow – John James Senate race using Google sheets and Datawrapper.
Get election results
First, head over to the Michigan Secretary of State website for the full download of the 2018 election results. Go to Data -> TAB-delimited by County for the full dataset.

Open election results spreadsheet
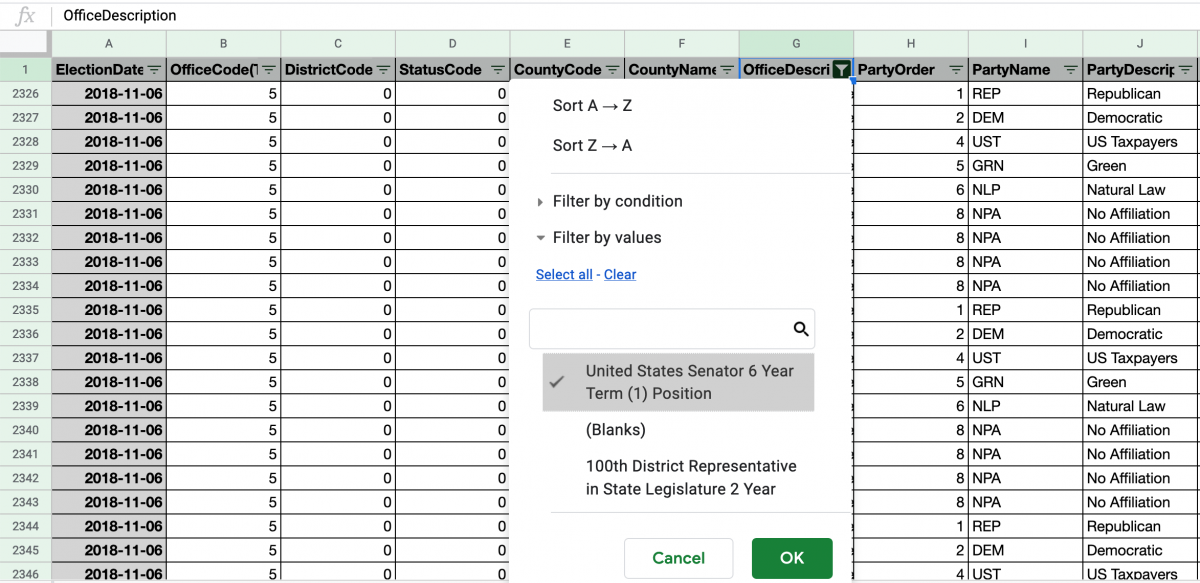
Copy that spreadsheet into Google sheets (or you can use Excel). Click Data -> Create a Filter. Click the inverted triangle next to the OfficeDescription column and clear all values. Select United States Senator 6 Year Term (1) Position. Click Ok.
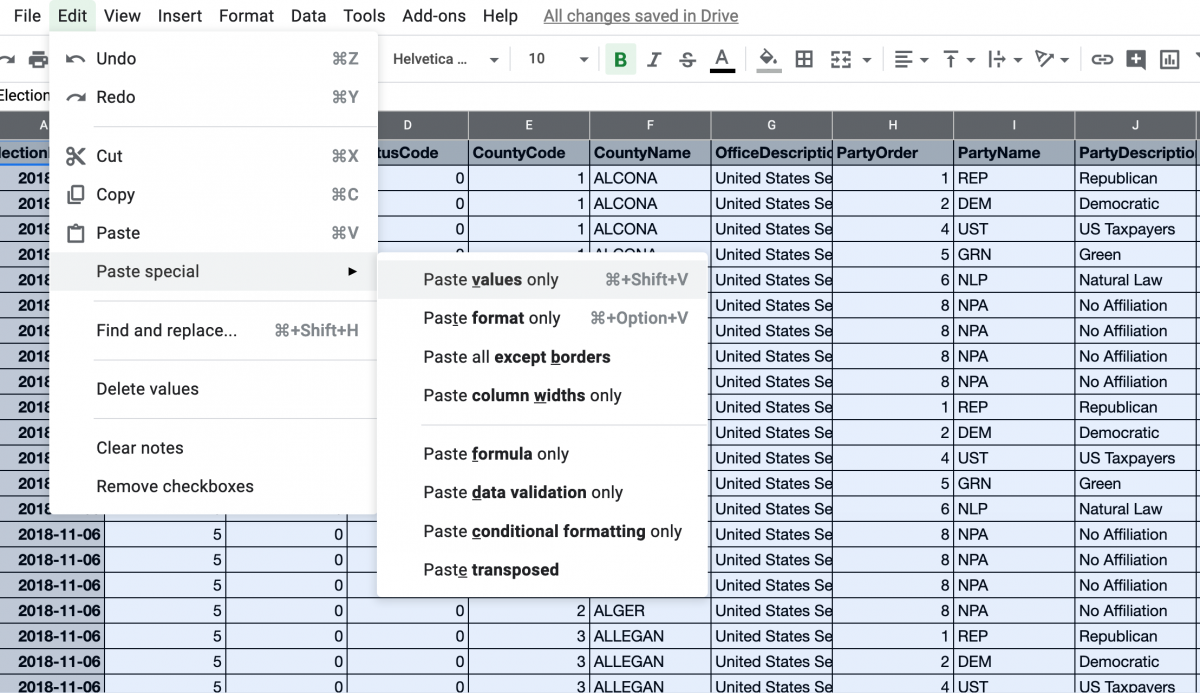
Copy the entire spreadsheet and, in a new sheet, click Edit -> Paste special… -> Paste values only to bring in your filtered data.
Create pivot table
Next, we’ll create a pivot table to look at results for each candidate by county. We’ll do that by clicking Data -> Pivot table…
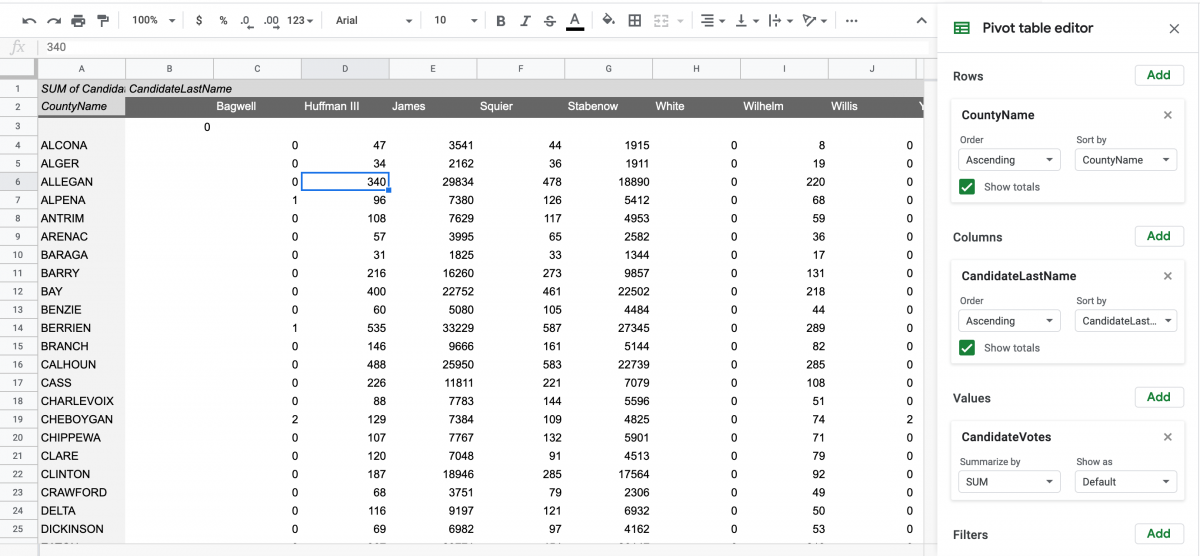
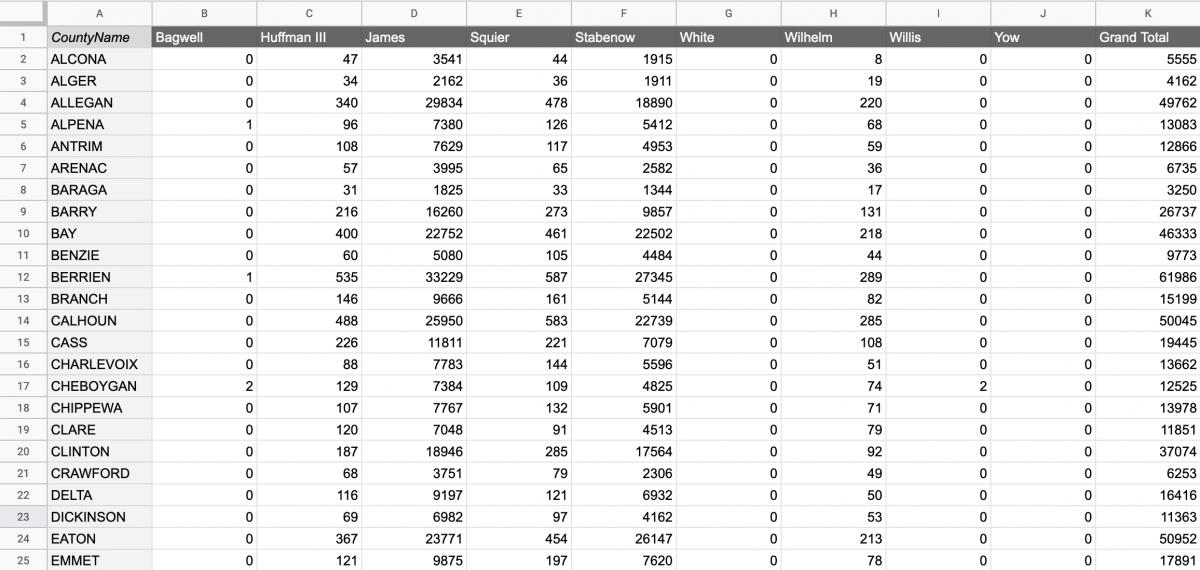
We’ll create the pivot table in a new sheet and placing CountyName in Rows, CandidateLastName in Columns and CandidateVotes in Values. That should generate a pivot table that looks like this:
Now, we’ll copy this pivot table into a new sheet and delete Column B and Row 2 to clean up the table. We’ll also freeze Column 1 and Row 1 by selecting View -> Freeze.
Calculate margin of victory
In elections, the margin of victory is calculated as the winner’s percentage of all votes cast minus the second-place candidate’s percentage. Whether or not that margin of victory is provided by election officials, it’s good to calculate it oneself.
To do that, we’ll create three new columns: Stabenow %, James % and Stabenow margin.
Next, we’ll calculate Stabenow’s percentage for Alcona county in the 2nd row by dividing Stabenow’s total votes in that county (cell F2) by the total votes cast in the county (K2). In other words, L2’s formula should be =F2/K2. To calculate James’s percentage of the vote for Alcona county, we’ll insert the formula =D2/K2. Finally, we’ll calculate Stabenow’s margin by subtracting James % from Stabenow %, or =L2-M2. In counties Stabenow lost, the result should be negative. In counties she won, it should be positive.
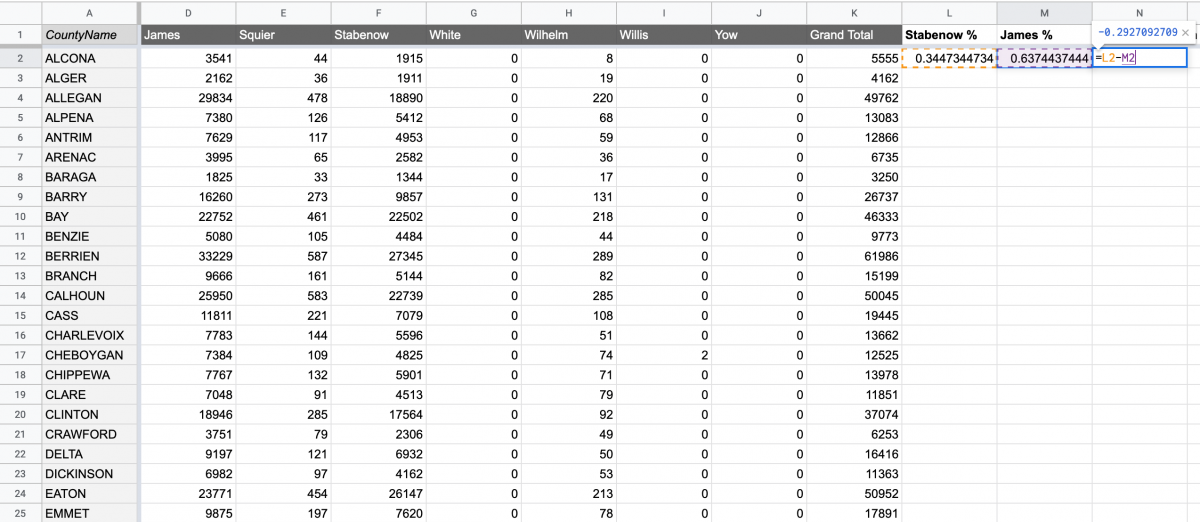
Next, highlight L, M and N in row 2 and click the bottom-right of cell N2 to calculate these for the rest of the counties.
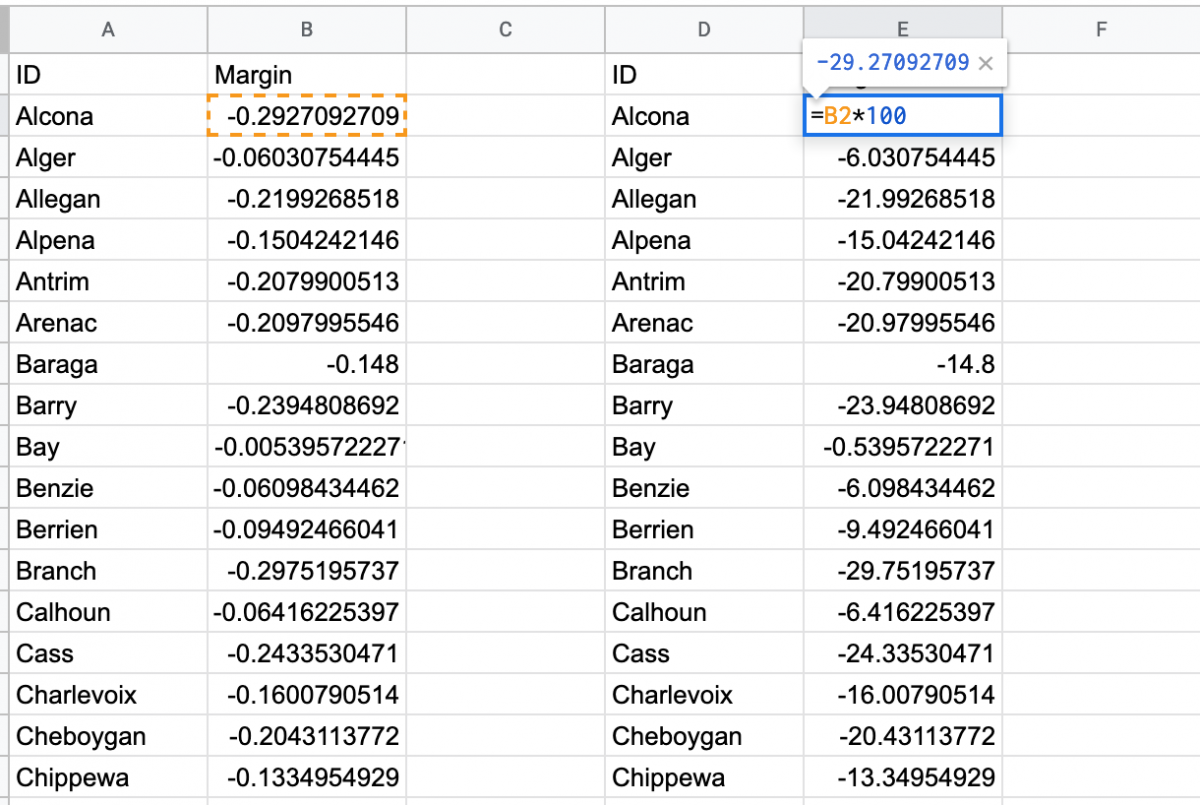
Finally, in order to create a clean sheet that is simple to paste into Datawrapper, I’ll bring over the state column and the margin column into a new sheet, being careful to paste only values. I’ll also rename the county column to “ID” since that’s how Datawrapper likes it.
And since I want to display the margin of victory as percentages in Datawrapper, I’ll have to multiply the margin column by 100 first (and add the % sign in Datawrapper). To do that, I’ll duplicate the ID column, copy it into column D and then calculate a new Margin column with =B2*100 and then double-click bottom-right of cell E2 to extend the formula to all counties.
Copy data into Datawrapper
The Datawrapper team has been constantly updating their data visualization product and the possibilities are myriad. And it’s free!
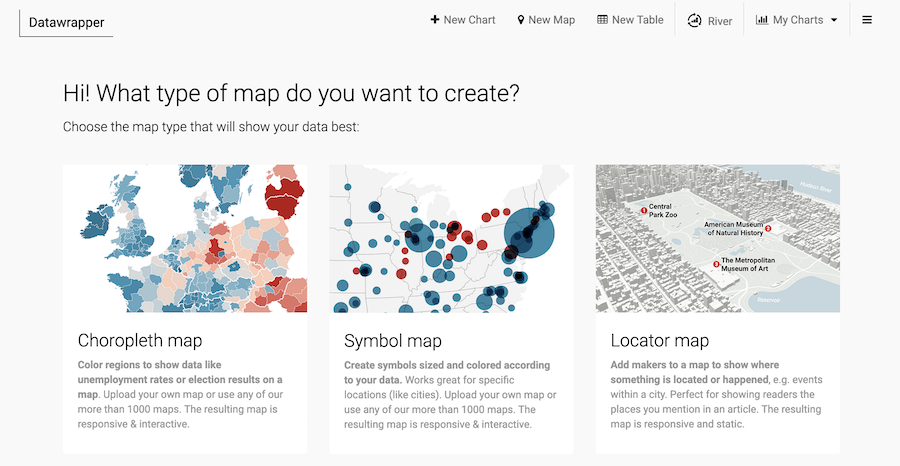
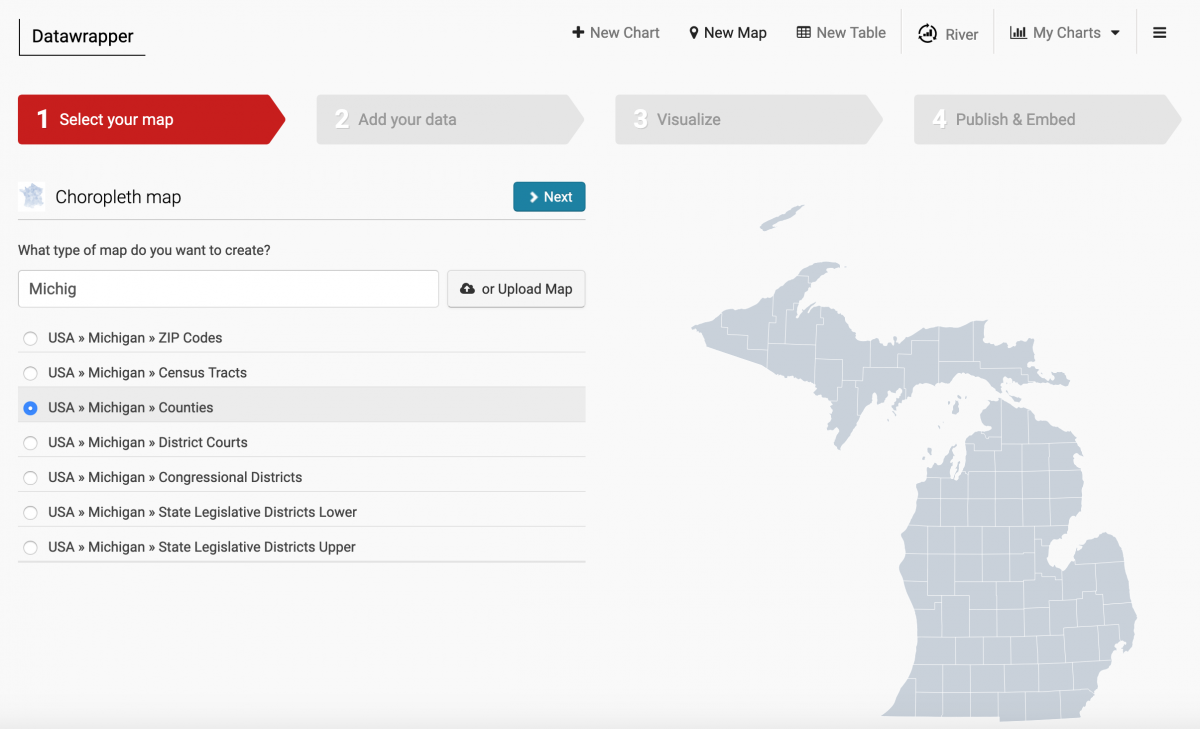
Once you head over to Datawrapper.de, click New Map. Then click Choropleth map.
Type in Michigan and click the USA > Michigan > Counties map.
Click Next and then scroll down to the “Import your dataset” button. Click it. Click “Start Import” and you’ll see an empty table:
Go back to your spreadsheet and copy the last ID and Margin columns you created. Paste them into this table in Datawrapper.
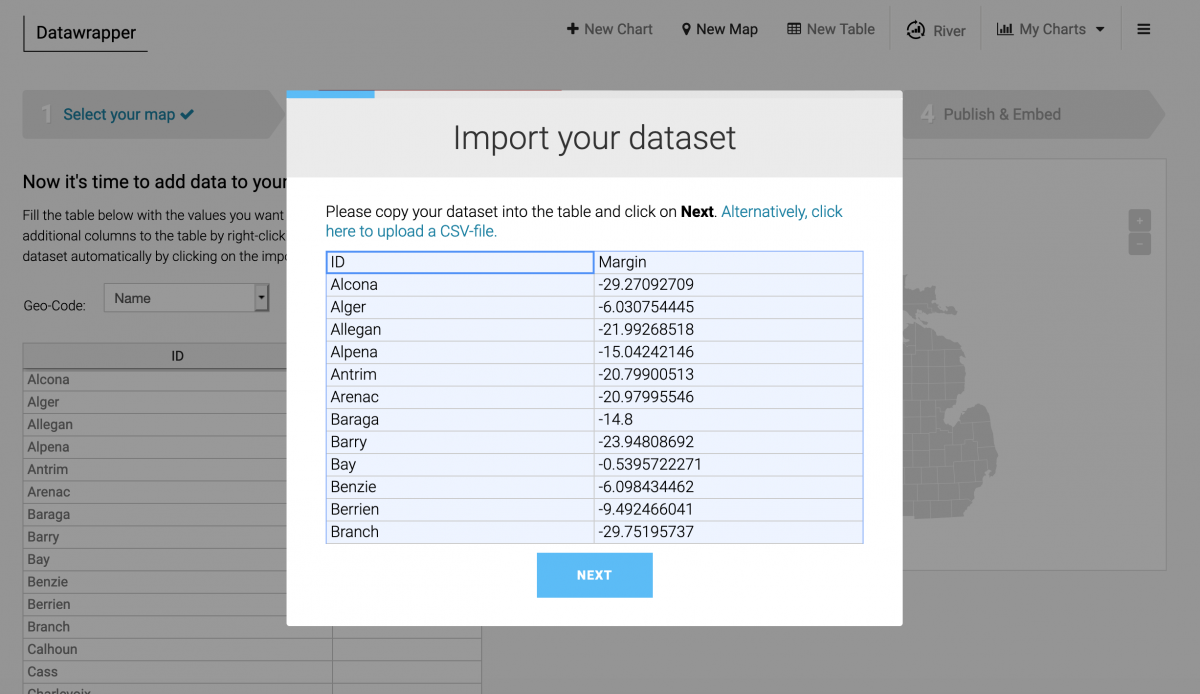
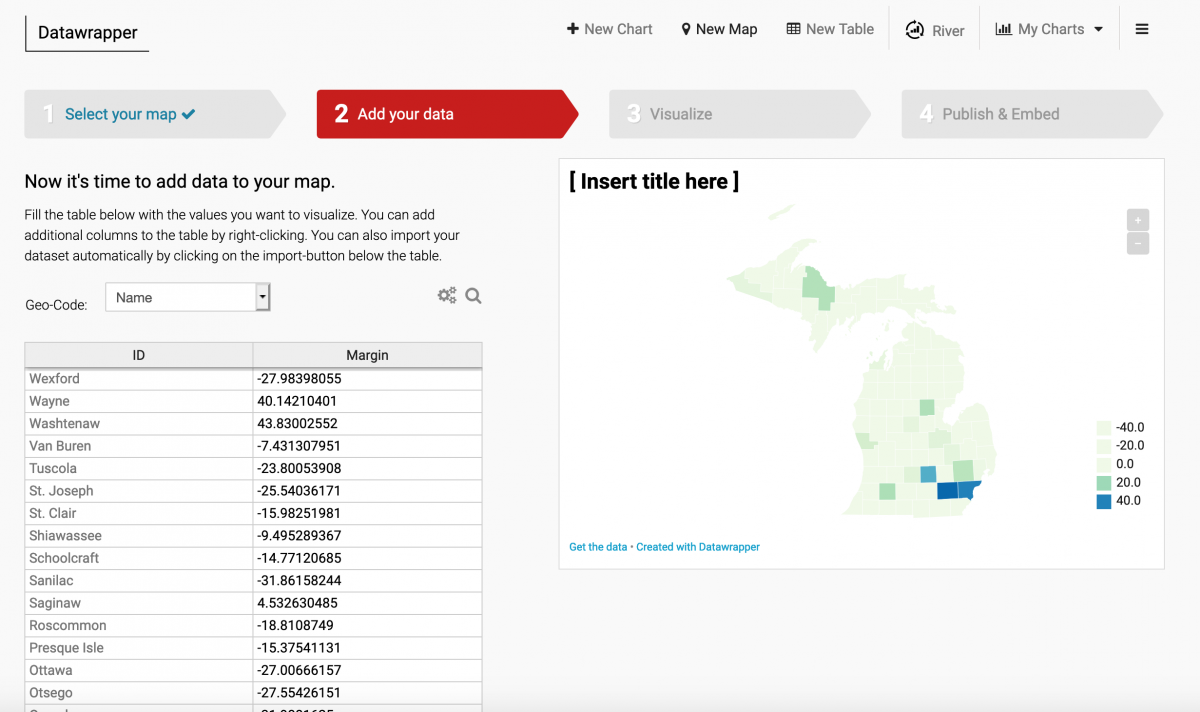
Click Next. Follow instructions to match the ID column as Name and the Margin column as values. Make sure you’ve ticked the “First row as caption” box. Once imported you should have this:
Design your map in Datawrapper
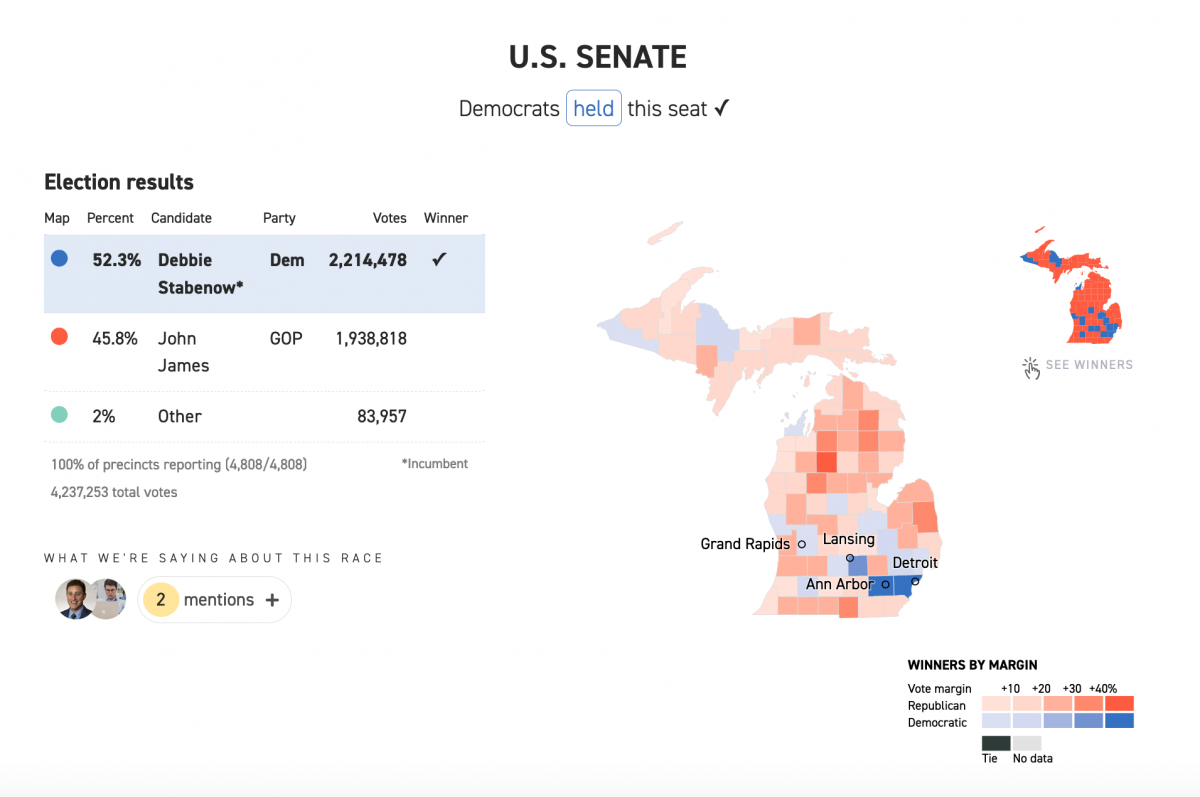
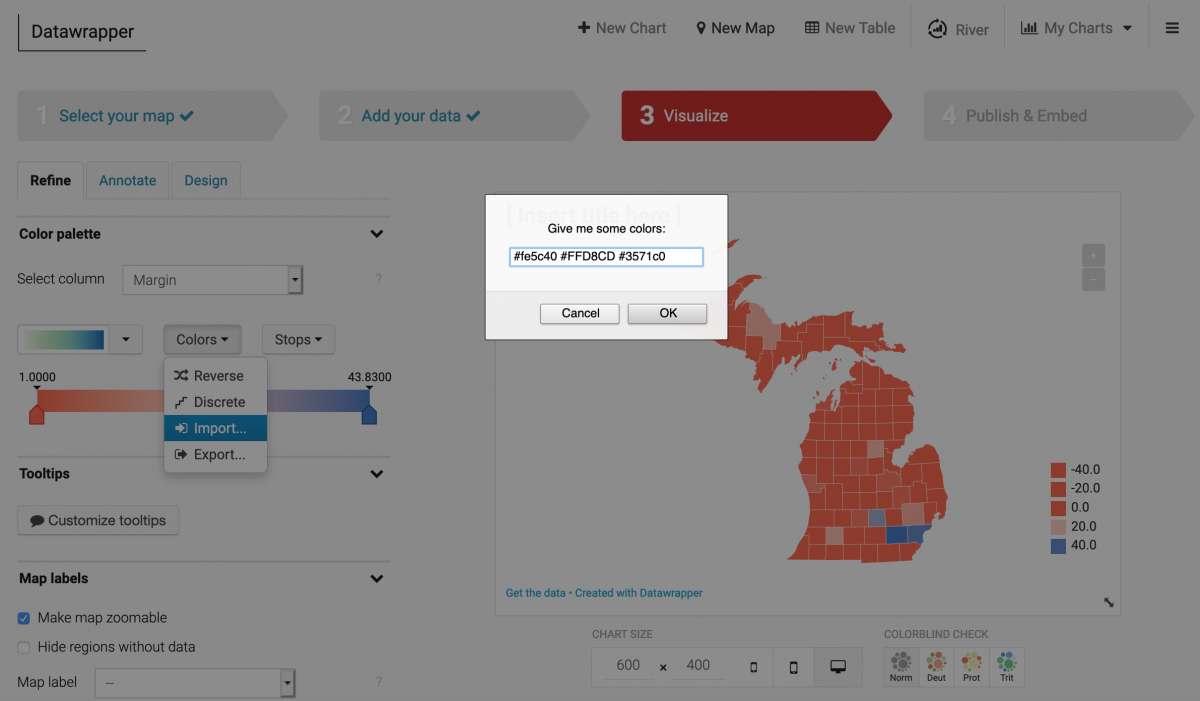
Let’s take a quick look back at the Politico margin of victory map. Ok, we’re getting close! Let’s first add Politico’s color scheme, which I’ve approximated as the HTML hex codes fe5c40, FFD8CD and 3571c0 for red, pink and blue.
Over at Datawrapper, click Proceed to get to the Visualize step. Click Colors under Color palette and click the Import button. Then paste in #fe5c40 #FFD8CD #3571c0 to insert your own color scheme.
Next click Stops and select min/median/max to classify the data. I’ll shift the pink arrow on the color bar a little to the right to most closely approximate the Politico map. Once I’m happy with the color ramp, I’ll go to the Map Key and deselect “Automatically generate legend.” Instead, I’ll add the values -40, -20, 20 and 40 and add their captions with a percentage. I’ll also add a title, Winner by margin, and place it on the bottom-left.
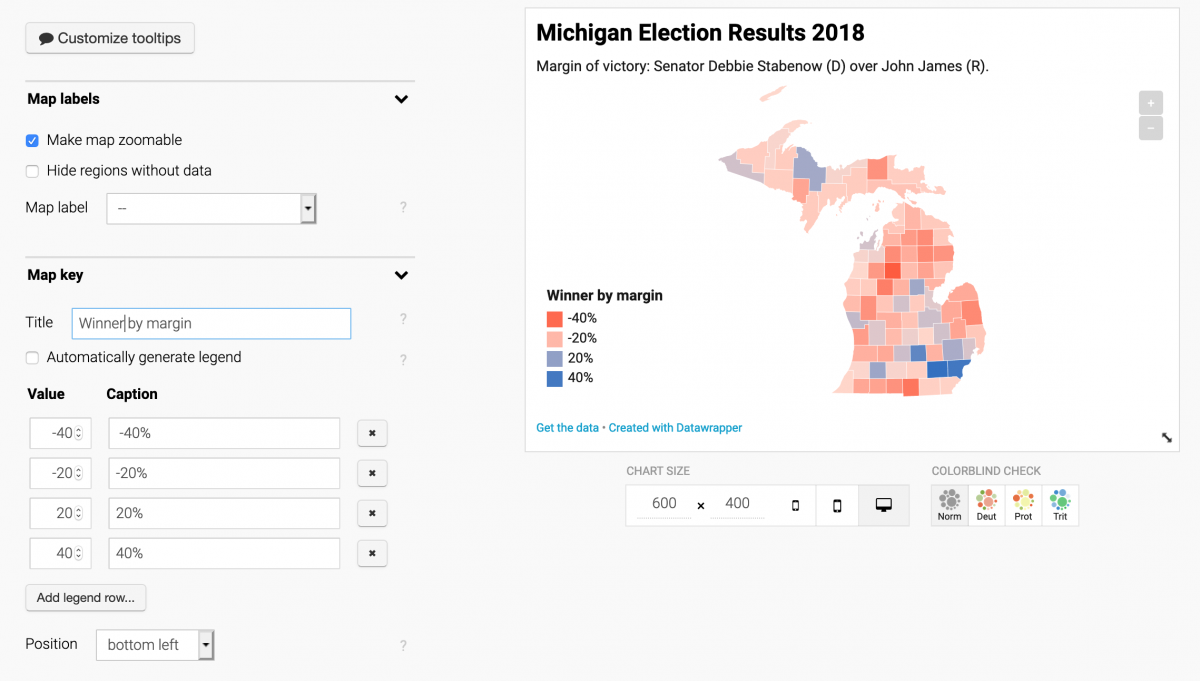
Under Annotate I’ll add a title to the map: Michigan Election Results 2018 and a Description as a subtitle: Margin of victory: Senator Debbie Stabenow (D) over John James (R).
Finally, I’ll go back to Refine and click Customize tooltips and ask Datawrapper to pull the county name and margin value using curly brackets for those fields and some HTML for a line break:
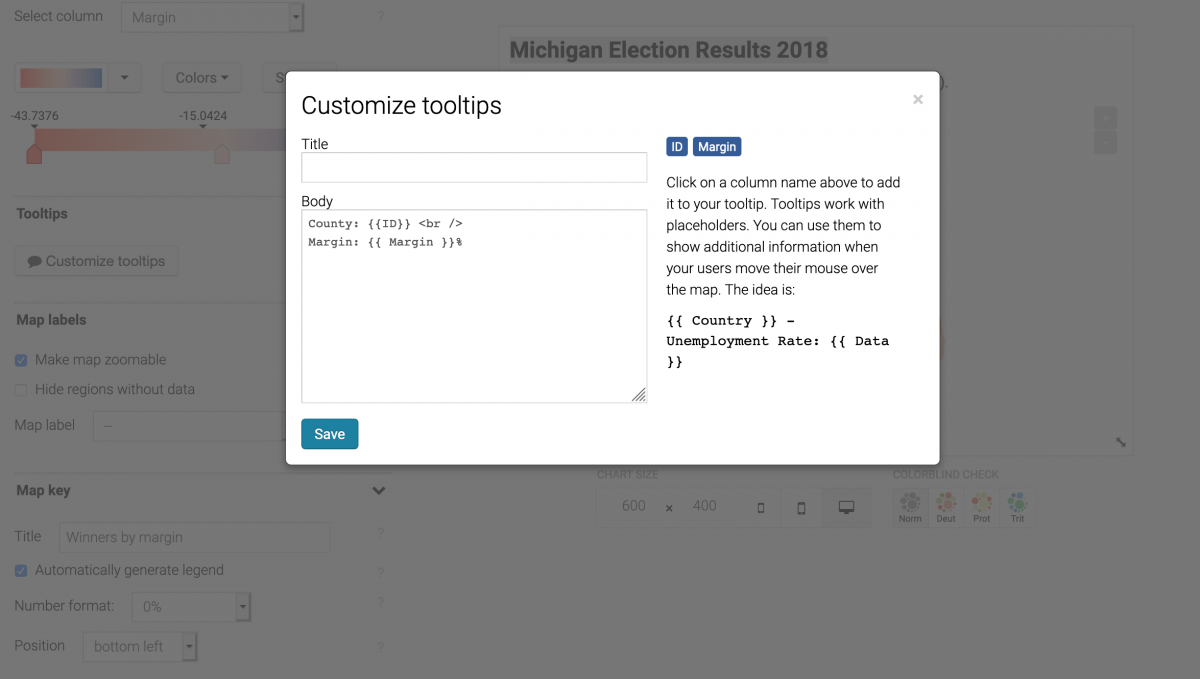
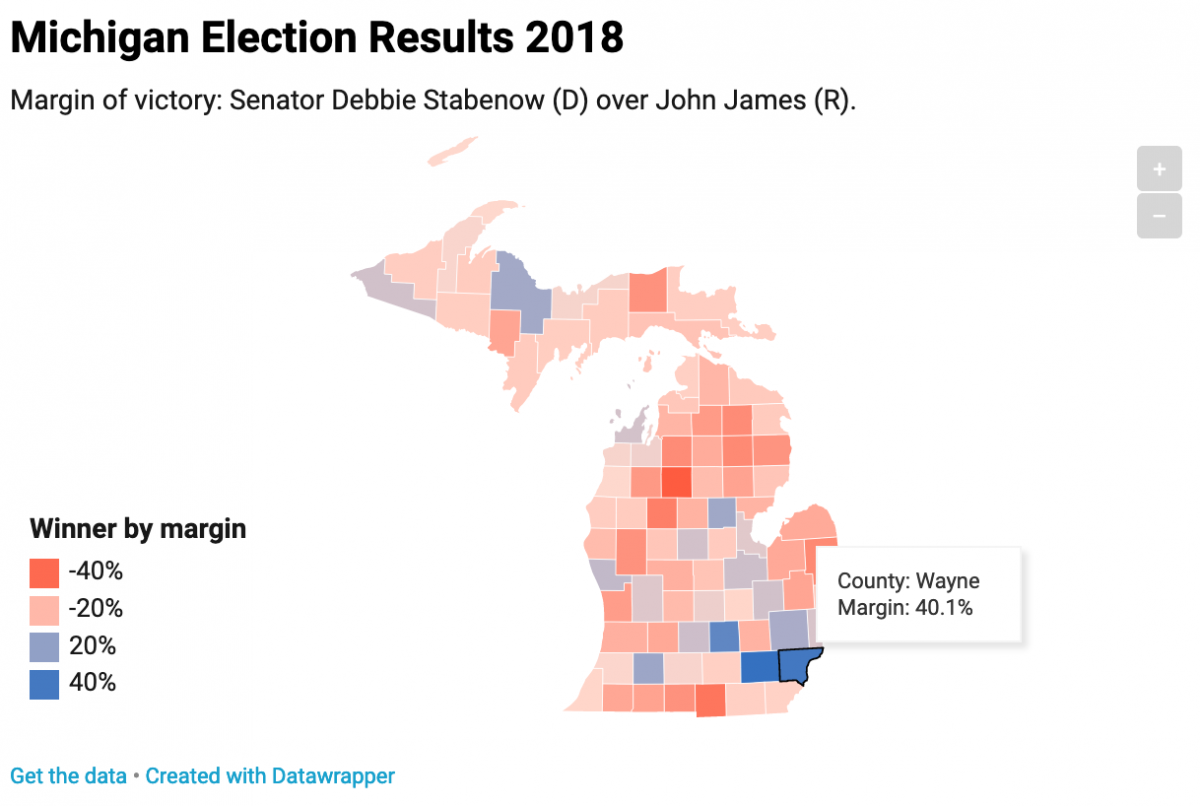
Now if I hover over Wayne County, the state’s most populous and home to Detroit, I’ll see the county name and Stabenow’s margin of victory.
Next, I’ll click Publish and Embed and click Publish chart.
I can now embed this chart as an iframe, such as below, or point people to the full URL.


How do you figure out the margin if you have more than two candidates and want to map that? For instance, what if you have a multi-party system with three candidates where maybe all three candidates win at least one district apiece?