
SXSW: Key takeaways on data journalism from the “news nerds” panel
Nearly every news story you read today involves numbers. Many news outlets, like The Washington Post and The New York Times, have found effective ways of presenting stories with data-heavy information to readers through alluring, interactive visualizations.
So it comes as no surprise that data and technology are big topics in this year’s News and Journalism track at SXSW. In a panel discussion last Saturday, data journalists talked about where to find data, tools for extracting information, and different ways of presenting findings to readers.
Find out what’s countable and find an angle
Every beat has data. Topic areas like education, environmental science, and politics are rich in data and often encompass reports and statistics that are accessible to journalists, offering a multitude of story possibilities. Even datasets that are widely available and have been combed-through can be approached with a new and different angle, the panelists said.
Sarah Cohen, Knight Chair in Data Journalism at the Walter Cronkite School of Journalism and Mass Communication, offered her methodology for sourcing new data: Go back to the real world.
“I was coaching a former student… on how can we watch the Puerto Rico diaspora going out,” said Cohen. “So, we started just walking through what are the all the things you do when you move: you go to the post office and you change your address, you register your kid in school, you might register to vote, you might buy a house, you might have to turn on a utility.”
Go through the things that someone does in real life, Cohen said, and look for the points of activity that intersect with levels of government you can access through public record requests.
If the dataset does not exist, make your own
More often than not, the data set you seek may not exist. If that is the case, make your own, the speakers recommended. In the last few years, there has been a big data push in areas on civil rights and criminal justice issues, areas in which statistics have previously been hard to come by, said Allison McCann, a VICE News data reporter.
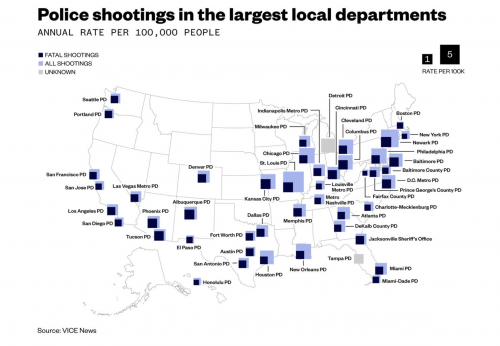
“There was next to no data around police shootings three years ago,” McCann added. “The federal government tracked nothing. So, newsrooms like The Washington Post and The Guardian started counting that. At VICE last year, we did a big effort to also track non-fatal shootings, which that data previously never existed.”
Another data set McCann worked on creating was at FiveThirtyEight for women’s sports. While there was a tremendous amount of data across all men’s sports, it just didn’t exist for women, she said.
Troy Thibodeaux, data science and news applications editor at the Associated Press, urged attendees in the room to be more creative in sourcing new data. He noted that there isn’t a lot of coverage on the entertainment industry or on tech giants like Google – which is due in part to the fact that Google is a private entity not subject to FOIA.
“I think people are expecting a lot more in spaces that aren’t politics and sports,” McCann said, commenting on data journalism’s inchoate spread across all news beats.
Treat your data like you would a human source
Just as you would background a subject in your reporting, you should also apply this practice to data sets. Treat your data like a source, always ask questions, and cross check your findings, the panel emphasized.
“I tell my team that every time you open your laptop, your mantra should be ‘all data sets are dirty,’” Thibodeaux said. “Expect it.”
He remarked that it takes a thorough examination to find any discrepancies in datasets, and that even governmental data sources require cleaning up. Often times, the agencies themselves are unaware of discrepancies.
It is important to check the data internally for outliers, Thibodeaux said, but also make sure to look externally to provide context. This can determine if the information is in line with comparable datasets. Regarding third party sites, a conservative approach is best: Check the methodology and the intention of the data collection. Be wary of why and how the group obtained their information and, if you do choose to use it, be transparent with the readers about its point of origin.
McCann said that, when working with the police-shooting data, she relied not only on the reports from different departments, but also upon local news coverage and social media outlets. As it turned out, there were three reports in Portland the police department missed because they were misfiled.
“You should always be asking questions of your data in the same way that you do of humans,” McCann said.
Journalists are information synthesizers, seek the simplest way to share information
The panel agreed that the key to creating effective visualizations is finding the simplest way to convey the information, making it easy for readers to consume. They suggested a shift away from highly complex graphics to more straightforward representations of the data.
McCann said, while it’s not new, she is a huge fan of The R Project in terms of sorting large datasets, specifically referencing the work done by Amanda Cox as the editor of The New York Times’s The Upshot section, anything in the Hadley Wickham portfolio (including ggplot), and graphics built with D3.
If anything else, Excel still gets the job done, McCann said humorously.
The speakers also underlined the importance of sharing not only data analysis but also the raw data itself in order to give the reader a fuller picture of the reporting so they can draw conclusions or even replicate the work.
The panel concluded that data analysis, when presented correctly, can tell a fascinating, important story in a clean and efficient way.
- SXSW: Key takeaways on data journalism from the “news nerds” panel - March 17, 2018
- SXSW: For women in journalism the future is not bleak. But there’s a lot to work on. - March 12, 2018
- SXSW: Bernie Sanders thinks the average American is “disgusted with the current political process” - March 11, 2018


