Northeastern hackathon creates tools and stories to better understand food insecurity in Boston
Not every Boston neighborhood has equal access to healthy, affordable food. The city’s food system, in fact, is rife with vulnerabilities – from storm surges to food waste to transportation issues. So how can Boston maximize access to healthy food and protect its food web from disruptions?
This question guided designers, data scientists and storytellers from a range of disciplines and industries to present solutions to food security in Boston at Northeastern University’s “Sourcing Boston” hackathon last weekend. Kicking off the event were 5-minute lightning talks by Brian Romer at Thomson Reuters Labs, Global Resilience Institute post-doc Liz Allen, Project Bread’s Leran Minc and Red Tomato’s Gideon Burdick.
Hackathon participants bridged distinct backgrounds and skillsets to form teams exploring issues like seniors living in food deserts, the cost of organic produce in Boston, and the impact of sea level rise on grocery and convenience stores. Pizza and energy drinks fueled the participants for approximately 24 hours to analyze and visualize various datasets, including City of Boston food access scores, historic and projected sea level rise data, and spreadsheets from two sponsor organizations: Project Bread, which shared information on school meals across Massachusetts, and Red Tomato, which provided their statewide produce sales data.
Organized by Aleszu Bajak and Dietmar Offenhuber in the College of Arts, Media and Design and Romer, the hackathon brought together sponsors Global Resilience Institute, TCB Analytics, RStudio, Project Bread and Red Tomato.
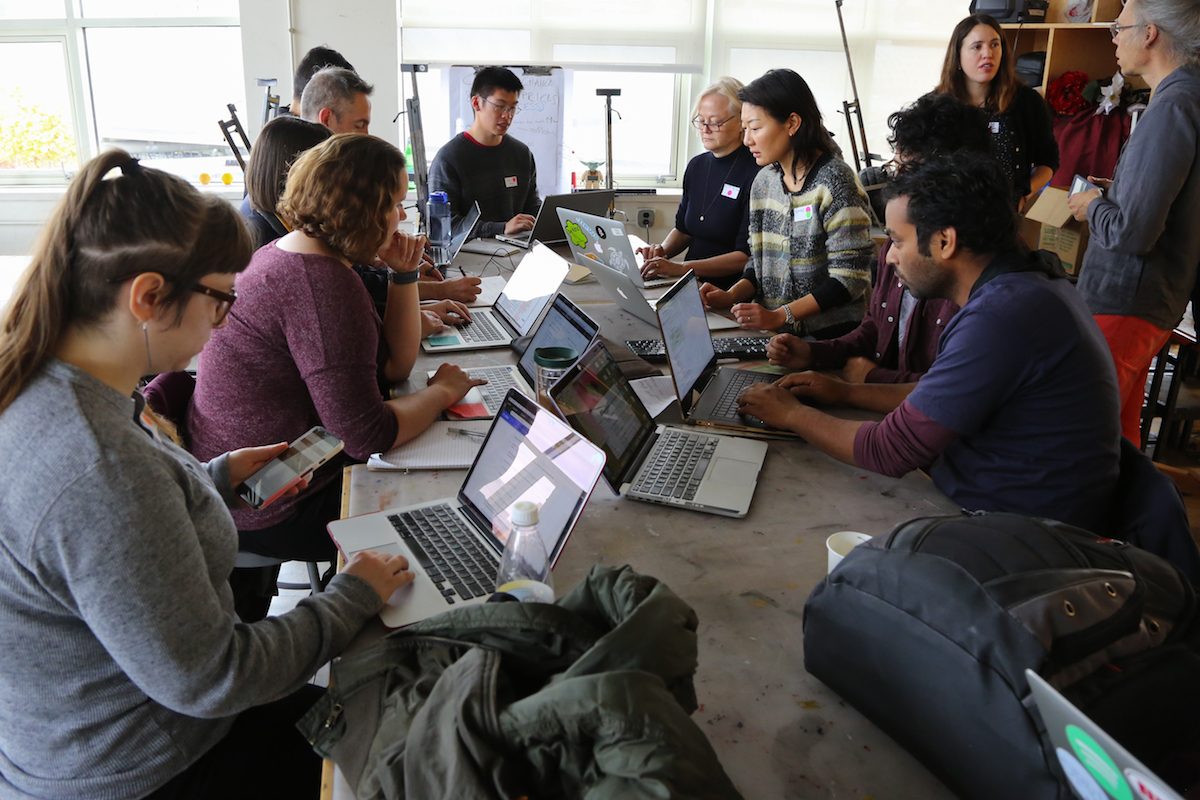
Winning projects mapped accessibility scores to Supplemental Nutrition Assistance Program (SNAP) sites and summer lunch distribution sites for low income students; mapped Boston food access and sea level rise alongside wealth in Hong Kong; and compiled weeklong schedules for access to food resources based on a given zip code.
At the end of the hackathon, a dozen teams presented their work before three judges: Thomson Reuters data scientist Liz Roman, Northeastern professor Christopher Bosso and Northeastern data visualization expert Steven Braun. The winning projects – which the judges deemed concise, creative, usable and suited to fill real needs – are outlined below.
First Place: Team “Sweet Potato”
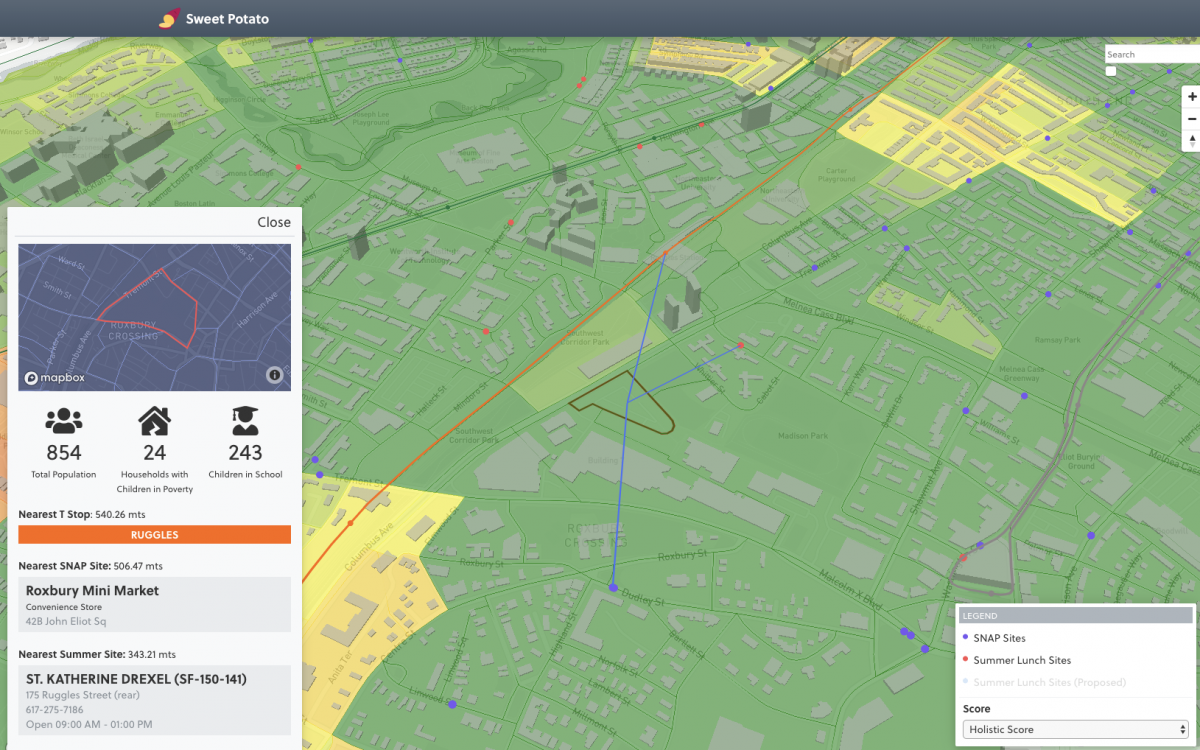
The team that took home first place looked at the availability of summer lunch programs for schoolchildren and SNAP benefit sites. Members compared this data to census data about population, households with children in poverty and MBTA transit stations to generate locational accessibility scores.
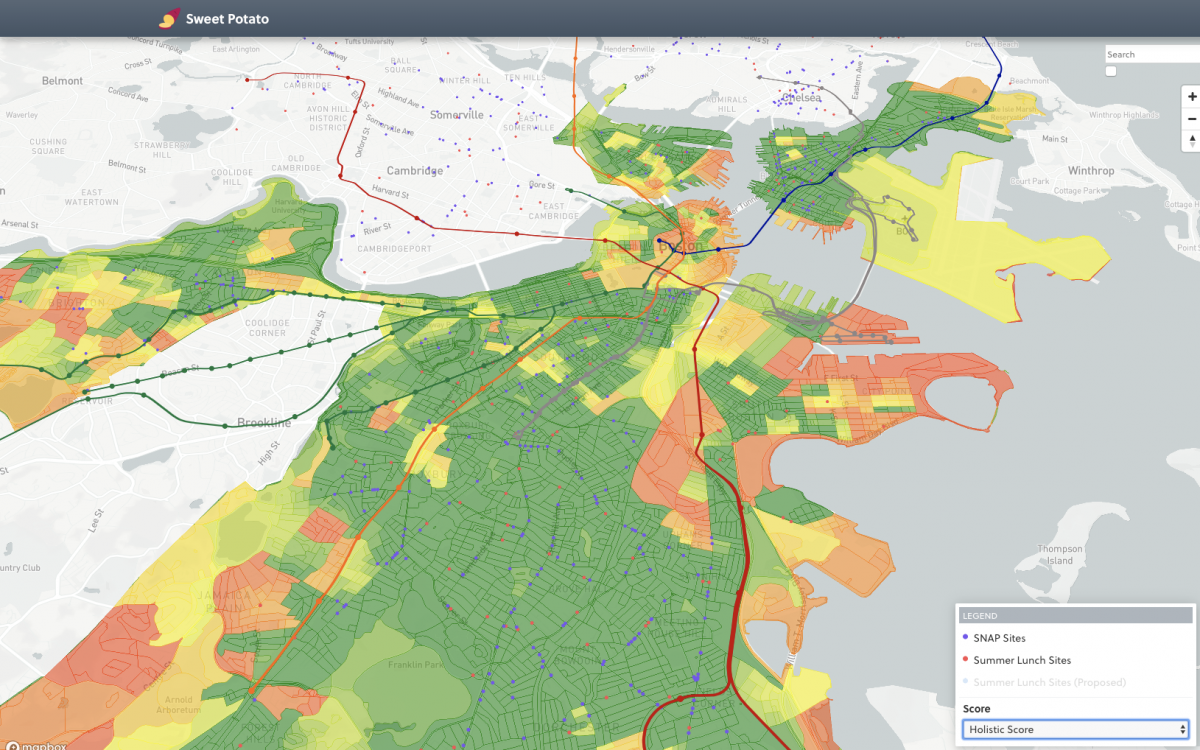
Using these scores, the team created an interactive heat map to illustrate accessibility citywide by identifying available resources and deficits. It also allows users to simulate what impact an additional summer lunch distribution center would have on a community’s accessibility score.
“Accessibility is always something that is important, especially in the food area,” said team leader Nico Tejera. “Once you are able to visualize a problem, we think it’s much easier or more clear what the problem is and where it is.”
The Sweet Potato team comprised employees of a city data analytics company called Tolemi. “It’s something we have experience doing, but applying different skill sets to different problems was super interesting,” Tejera said. “We haven’t really gone to a hackathon before as a team, so it was definitely encouraging to continue to get involved in our city’s problems.”
Team “Sweet Potato” also open-sourced their code, so other researchers and organizations can use and expand on it if they want, or even the City of Boston itself.
Second place: Team “Gourmet Disco Apocalypse”
The second place hackathon project expanded beyond Boston to look at the cost of produce in Hong Kong to show variation in the wake of extreme weather events.
Daisy Tam, a Fulbright visiting scholar from Hong Kong Baptist University at the Urban Risk Lab at M.I.T., came prepared with relevant historical price data for the region. Unfortunately, there was no available data on Boston food prices, so no direct comparisons could be made. So, to stay aligned with the “Sourcing Boston” theme, the team examined the impact of sea level rise on food access, said member and Northeastern marine science PhD student Sara Williams.
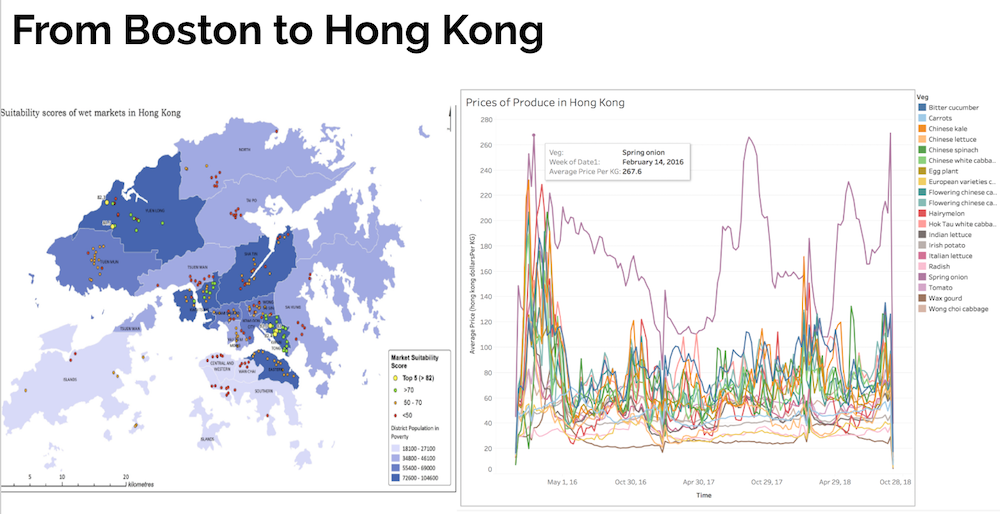
Williams said Boston had previously done great work visualizing climate change in the city and separately had good maps of access to healthy foods.
“It was a question of how we get all those data sources into one area,” she said.
On Sunday morning, Williams said she loaded a variety of shapefiles into Carto.com, a program she’d never heard of prior to the hackathon. Using Carto, she and her team members were able to create an interactive map of Boston food access and sea level rise.
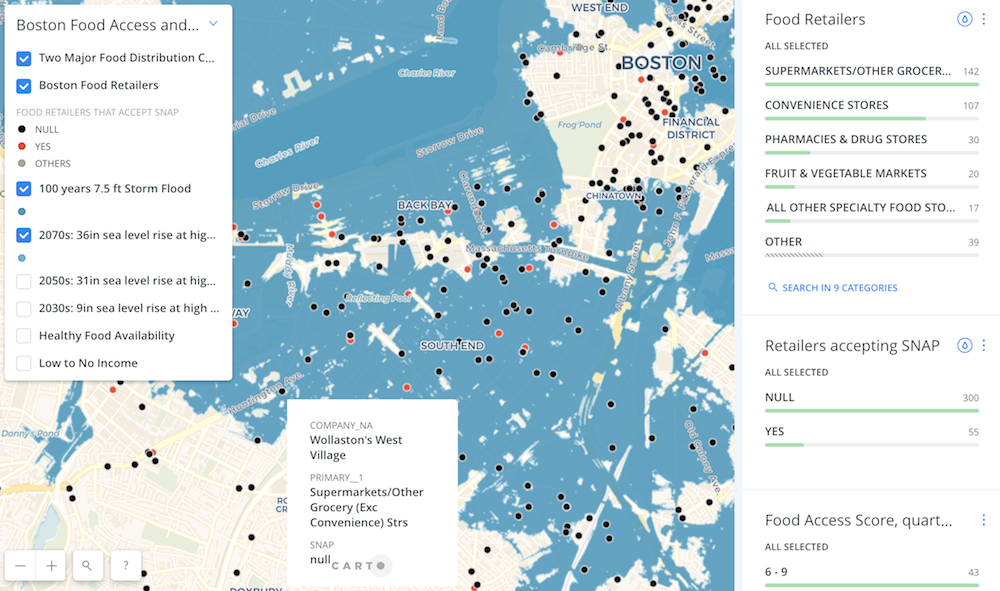
Based on the map, viewers can ask themselves more refined questions like, What would happen to two major food distribution centers in Chelsea? Where is the flooding going to be, and how does that affect food accessibility?
“This was my first hackathon. I had no idea what to expect,” Williams said. “Once I finally found the right platform for putting all the spatial data together, I was very happy to see it all come together.”
Third place: Team “Feeding Boston”
The hackathon’s third place winner created a web application to allow Boston’s food insecure population to more easily find all resources available to them.
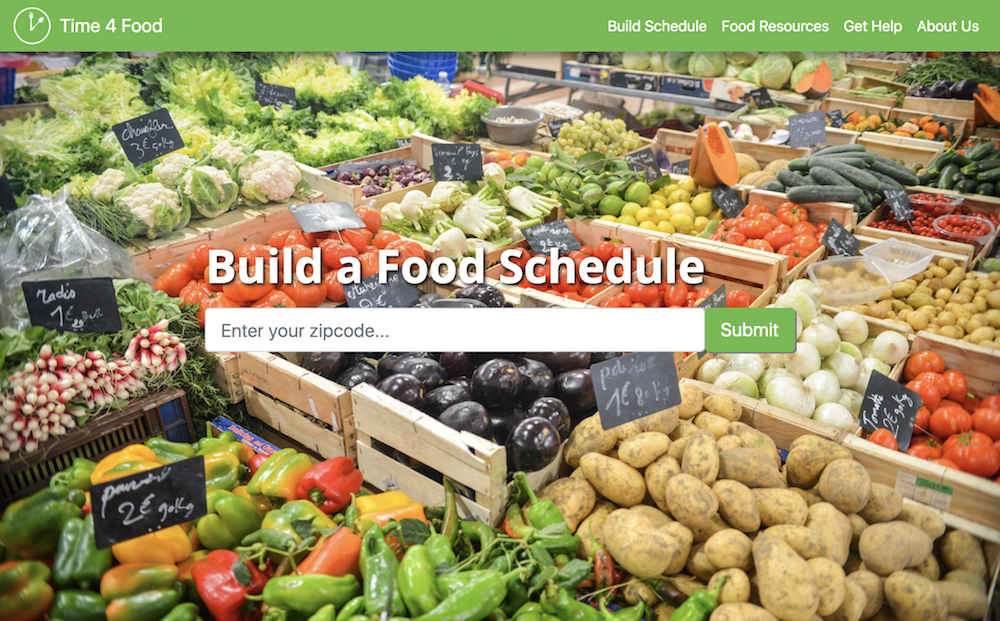
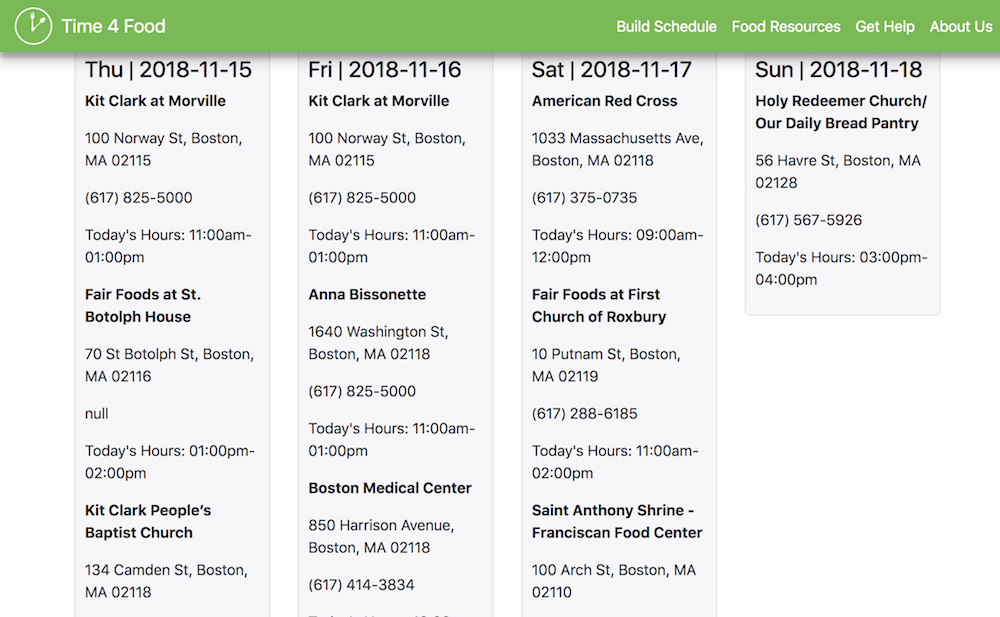
The app allows a user to input their zip code. Based on that, it generates a weeklong schedule that includes the addresses, phone numbers and hours of nearby food distribution centers. That includes churches, the American Red Cross, Rosie’s Place, medical centers and senior services centers.
Someone in need of these resources could print the schedule at a library or open it on a mobile device or computer. The Feeding Boston team said it could also be used by case managers, and even policymakers to identify gaps in food access resources. They made the app using data the city provided.
Judges said the project was easy to use and made sense to non-experts, plus it fits a real need. In their presentation, team members said if they had more time they would add filters so users could select what type of food resources they need or are eligible for. They would also create a way for food resource administrators to update their hours regularly, enable yelp-style commenting and support different languages.
Follow tweets from the event here.

