How one data-driven art and technology company is understanding cities with AI
Should New York have more than five boroughs? Are zip codes too large? As part of the Northeastern University Visualization Consortium‘s Fall 2017 speaker series, Mahir Yavuz spoke about Topos, the data-driven art and technology company he co-founded that is applying different methods and techniques from machine learning and artificial intelligence to reveal fresh insights about cities.
The problem with city data
Policymakers, governments, the postal service and companies are relying on city data that is out-of-date, Yavuz stressed. Using census data, for example, doesn’t allow one to capture quickly enough the flux of neighborhoods and people. Zip codes, he said, are too large to capture granular data about neighborhoods.
“Companies are using very old-school data and demographics,” said Yavuz. “We believe there’s a lot of opportunity there to fix the problems and find solutions… we realized that it’s not an easy problem to solve. You need to change the way you collect data asa government.”
That’s why Topos – which publishes blogposts here on its findings – is leveraging multiple data sources to understand the modern makeup of cities, he said. Using methodologies like hierarchical clustering, distance analysis, computer vision and natural language processing, the company is trying to understand the “culture of neighborhoods.”
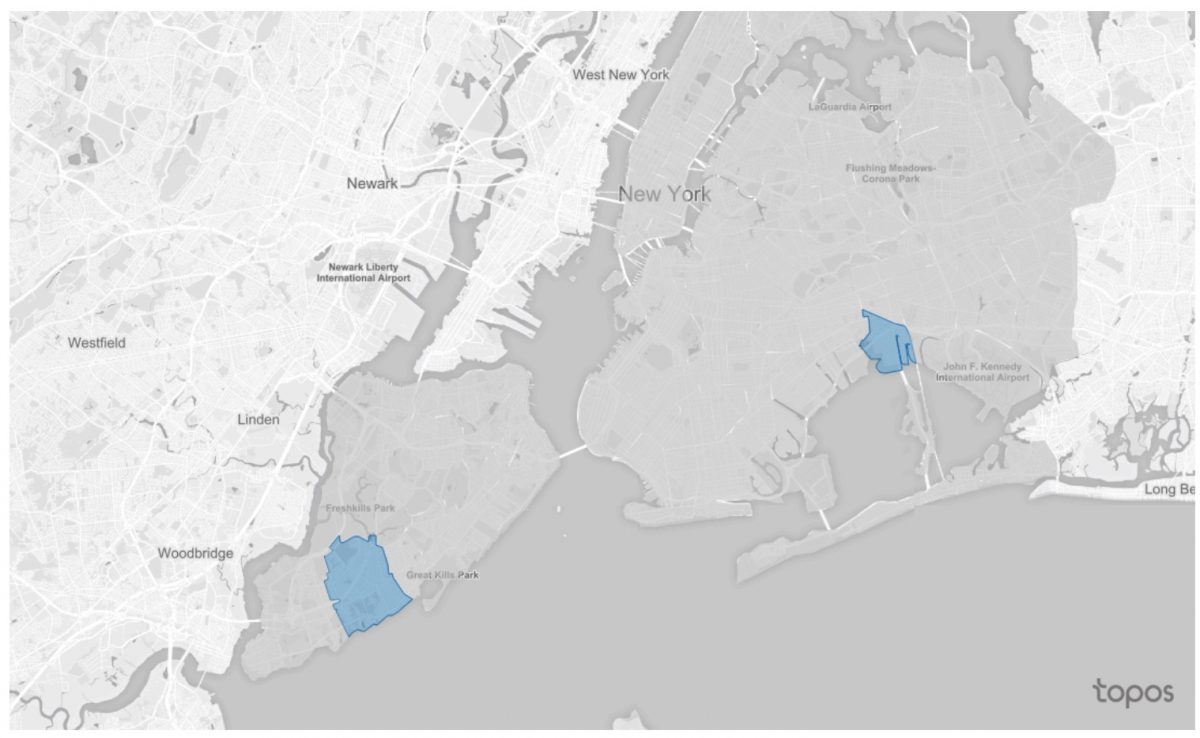
What does that mean and what have they found? One of Topos’s analyses, for instance, revealed that Howard Beach, Queens and Seaside, Staten Island were the two most similar neighborhoods in New York City when looking at average house value, waterfront real estate, and types of restaurants.
New York’s boroughs should look like concentric circles
Topos has also tried to break down New York’s five boroughs into regions that might make more sense than that outdated method of partitioning the city. Using principal component analysis, which split the city’s neighborhoods into vectors and organized them as dimensions, Topos found that the city could be organized along concentric circles – which break down by household income, late night pizza spots, and visual presence of nature. The outskirts of Queens, Brooklyn and Staten Island belong, in a sense, to the same borough – a borough for commuters. More on that project here.
A cautionary note
“There are a lot of people using city data and that makes it dangerous,” said Yavuz. Because the data is so complex, and biases tend to get baked into data analysis, these analyses need to be approached with care. Not all city data analyses should be used in policymaking, he said. That’s why, for now, he’s pumping the brakes on approaching politicians and city planners.
“We’re not working with the government right now,” Yavuz said, before catching himself. “Well, we’re not working with them yet. We’ve talked to people at New York City government… but it’s political.”
Other projects mentioned by Yavuz
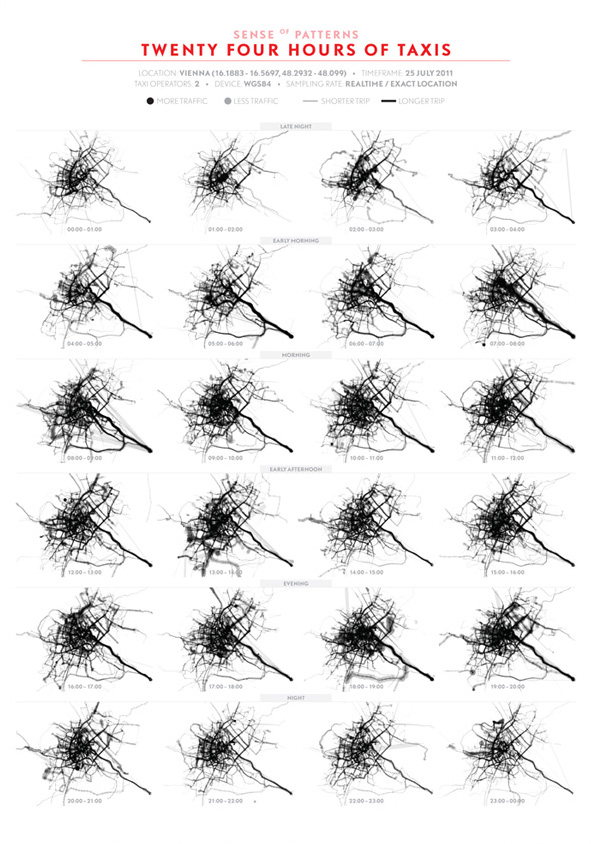
One of Yavuz’s early forays into city data attempted to make sense of traffic in Vienna in 2011. The end result: Sense of Patterns. Below, one of the visualizations Yavuz created using 24 hours of taxi trips.
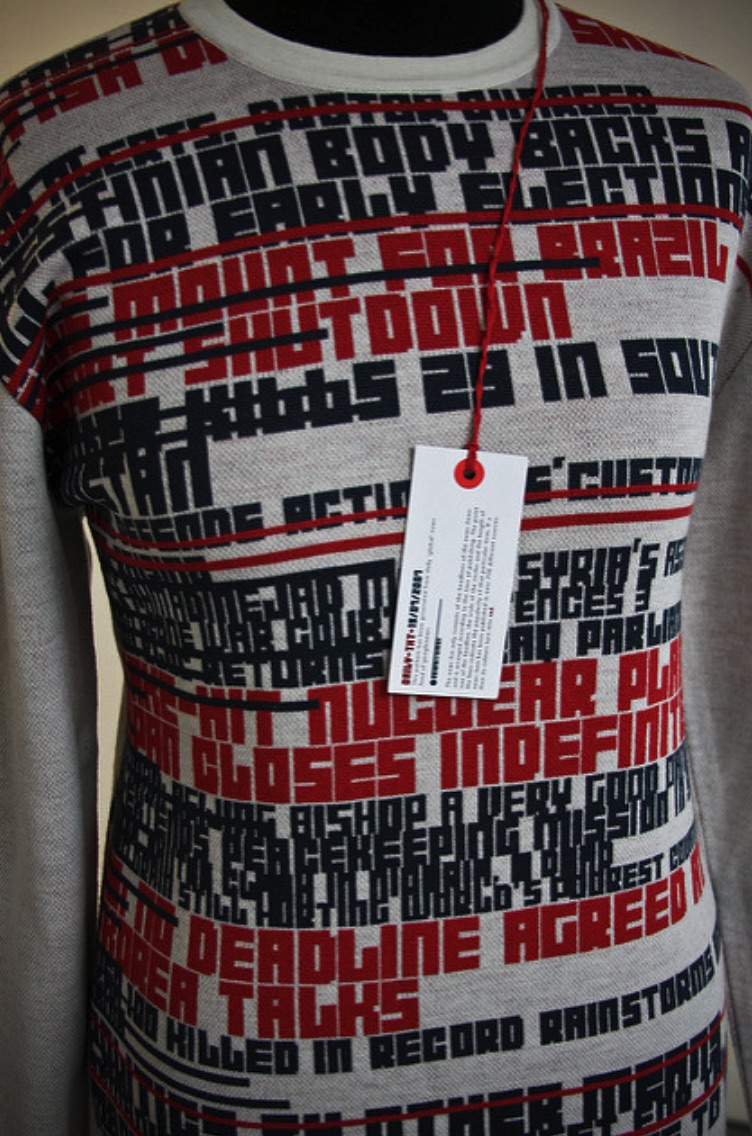
News Knitter: Using live data from the news, Yavuz and his team were able to knit new sweaters that visualized words, numbers and shapes from the media.