The revolution will be Instagrammed
Last February, when Ukraine erupted into violent civil unrest, the Internet was flooded with photos from Kiev. As the revolution was being documenting in real-time on Instagram, among other platforms, a team in New York City was wondering how social media differed from the pictures traditional media reports were painting. The results they found were surprising.
Lev Manovich, a computer science professor at the CUNY Graduate Center, wanted to present the entire story of the Ukrainian revolution in a way that the news consumer could understand. He and his team wanted to contextualize the signal (the protest) by visualizing its place within the noise (photos of everyday Kiev). Using photos from Instagram and custom filtering and visualizing software, they showed how social media differed from the pictures traditional media reports were painting.
“Social media allows you to have a larger window into what other people are saying, doing, or paying attention to,” says Manovich. “What else could we find on Instagram in Kiev?”
The context
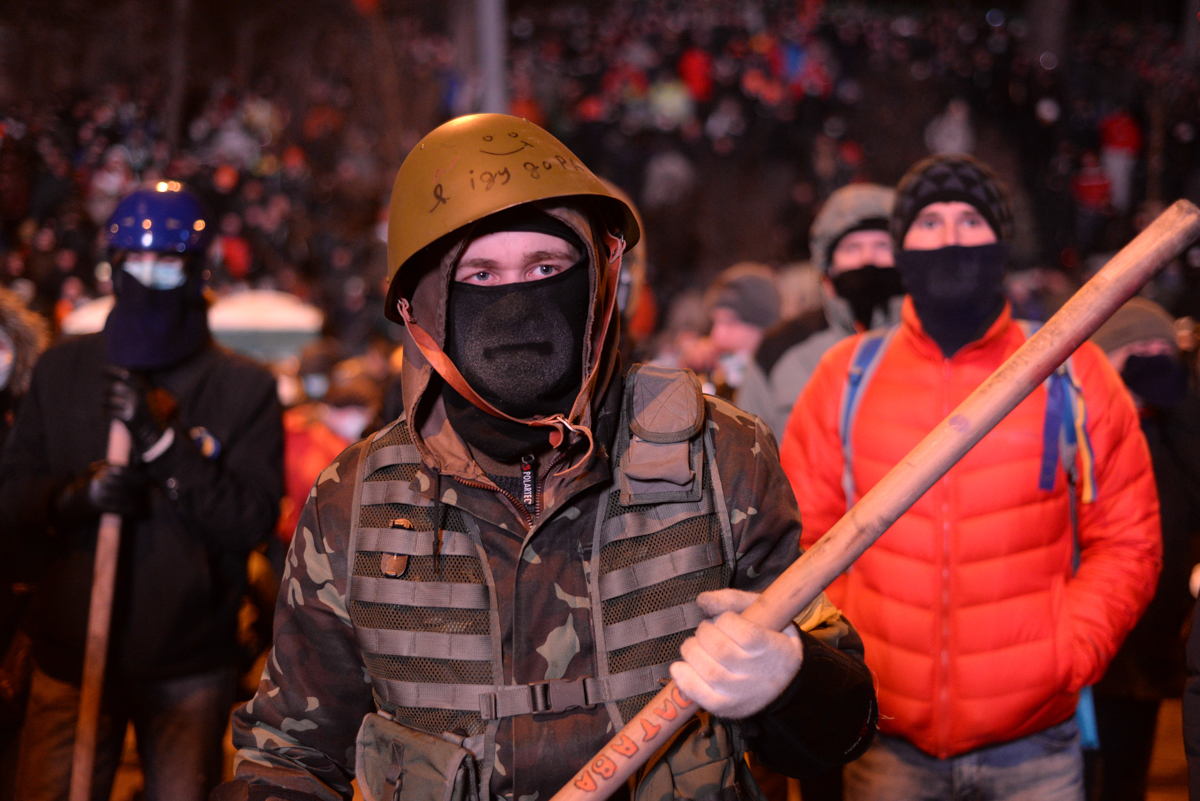
Ground zero for Ukraine’s 2014 revolution was Kiev’s Maidan Square, a place where dozens of people were killed in clashes between police and anti-government protesters. Some of the most violent days of the Euromaidan revolution fell between February 17 and 22, the dates Manovich and his team chose for analysis.
Manovich and his students initially looked at qualitative analysis of media reports and social media during the Arab Spring and Occupy Wall Street. The questions was a weighty one: How can one know when something is happening in a specific place and is what one consumes through mainstream media the full story?
The tool
Jay Chow, then a student working with Manovich and now a web developer, used a third-party service called Gnip. Gnip allows a user to plug in longitude and latitude into their API which will stream Instagram data, Chow says. Then he wrote a program that communicates with the Gnip stream which allowed for the download of every photo shared on the service from the center of Kiev, Ukraine for six days between February 17 and 22, 2014.
To do this, Chow wrote a simple Python code that would ask Gnip to collect every photo geo-tagged in the center of Kiev. That data was then dumped into a database built with MySQL, an open-source database management system.
The 13,208 photos collected over 144 hours (from 6,165 users) were then analyzed using software that Manovich and Chow had been developing since 2012 called ImagePlot.
ImagePlot, which they developed at CUNY, allows one to visualize the images. Manovich has used ImagePlot for projects such as PhotoTrails and SelfieCity. It can sort images by color and shading, as well as time, allowing the team to perform a “clustering” of similar images such as those containing objects against a lighter background, skylines against a lighter sky, or photos that had been cropped.
ImagePlot has been open-sourced on GitHub.
What is signal and what is noise?
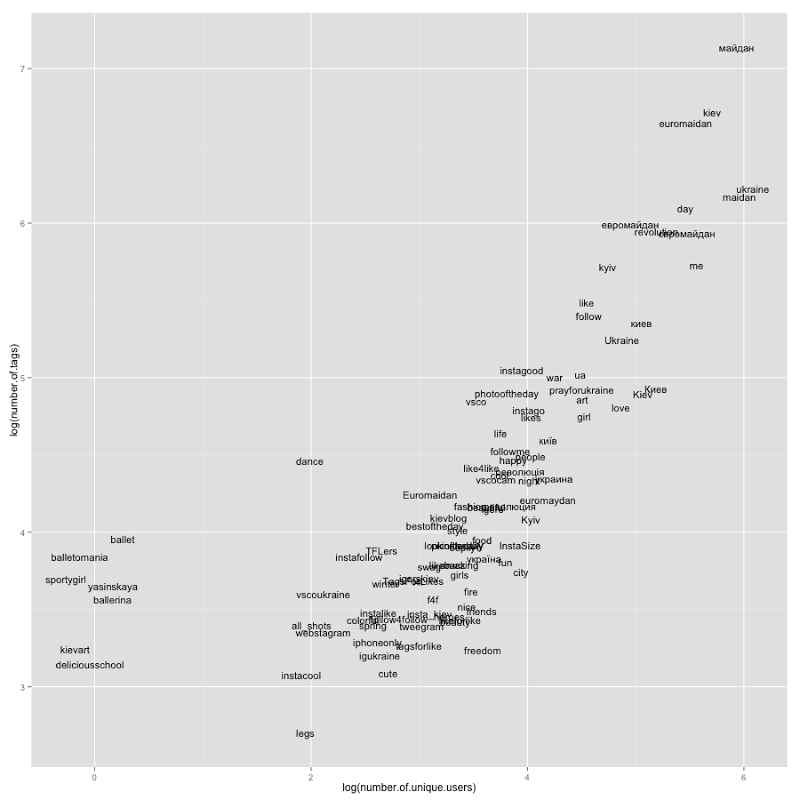
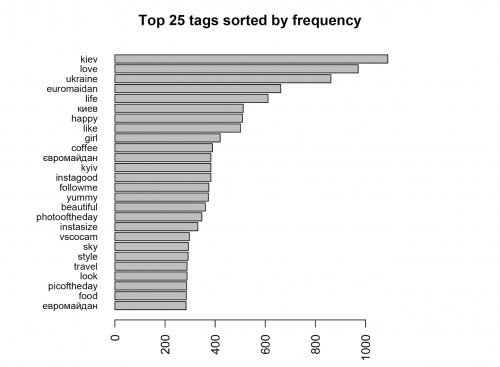 “It was so shocking to see these images of people dying and barricades coming up [alongside] with photos of the normal and the everyday,” says Manovich. To pinpoint photos shared by protesters or about the protest, Manovich filtered for certain revolution-related hashtags: #майдан, #maidan, #euromaidan, #євромайдан, #евромайдан, #euromaydan, #Euromaidan.
They found that the #Euromaidan hashtag was the most frequently used hashtag for protest related posts.
Sorting the exceptional from the everyday
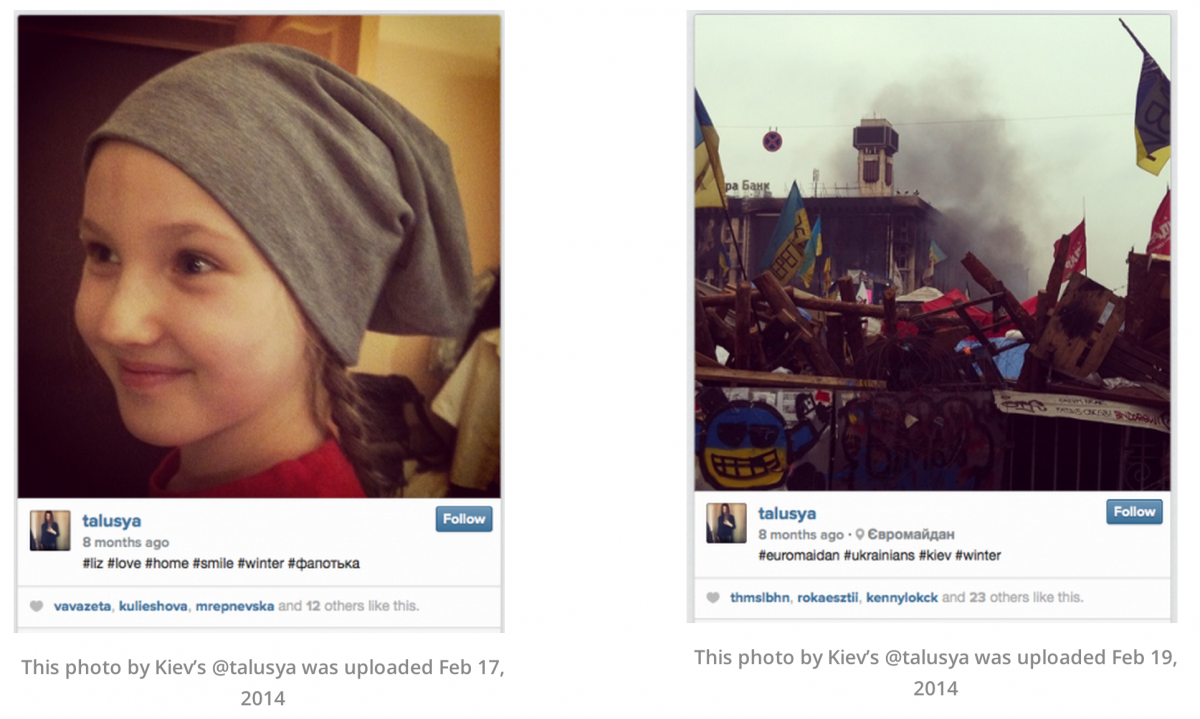
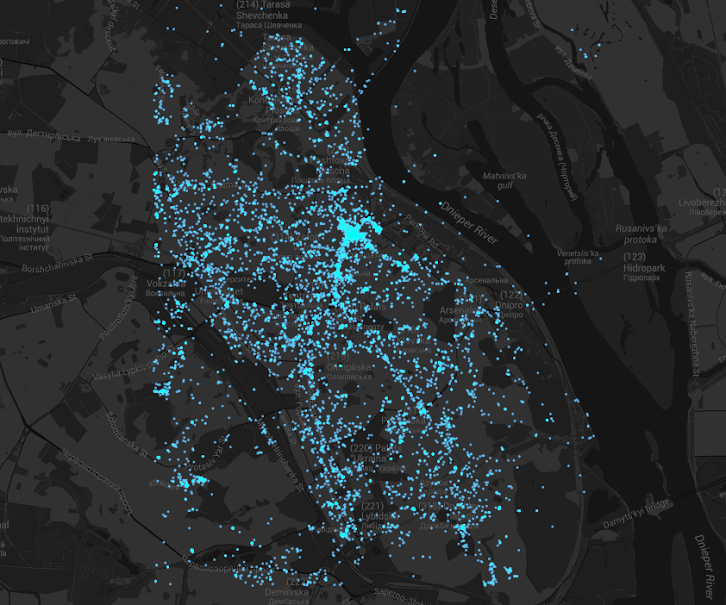
What surprised Manovich and his team the most was the sheer quantity of mundane photos that were mixed in with the photos chronicling the Euromaidan revolution. They write on their blog:
“Outside of the most intense days and the areas of protests, you would not even know that something political was happening. People post selfies and other photos of their lives, they dress up getting ready to go out, and take photos of cultural events. The images of Maidan clashes, political slogans, and burned cars and buildings appear right next to everything else.”
Implications for journalists and storytellers
Manovich has been studying the intersection of culture and technology for 30 years. “Where 15 years ago it was artists doing interesting projects, now it’s journalists,” he says.
“[The Euromaidan project] is my own contribution to the developing area of data journalism,” says Manovich. And though this kind of collage work with a large collection of photography was once confined to the realm of art, it’s become a tool that journalists should embrace, Manovich argues.
“Analysis and visualization of large samples of social media can provide an alternative to summaries of the events presented by historians, individual journalists, or groups of writers,” Manovich and his team wrote on their blog. “This is especially true for the visual summaries of the events. Instead of only a few views we now have many thousands and millions of separate views.”
These kind of tools and techniques are becoming increasingly available to help us navigate–and comprehend–this ocean of data. With Instagram in particular, there is the opportunity to sense what people are really seeing and experiencing on the ground, in effect ground-truthing rumor and speculation by putting a human, relatable face on what can feel far away and foreign. (Of course, Instagram does censor certain posts and countries like China have been known to block the service altogether.)
A quick deployment of photos using the Instagram API
[alpine-phototile-for-instagram id=964 user=”aleszu” src=”global_tag” tag=”euromaidan” imgl=”instagram” style=”wall” row=”6″ size=”M” num=”30″ border=”1″ align=”center” max=”100″]
Using the AlpineTile plugin for WordPress, I was able to pull a maximum of 30 images from Instagram. These are the latest containing the hashtag #Euromaidan.