A roundup of coronavirus dashboards, datasets and resources
Access and availability of data on the novel coronavirus and the disease it causes, Covid-19, are essential for understanding how the virus spreads, who is most likely to get it, and how to keep them safe.
This post is an attempt to round up a list of dashboards, datasets, media, and resources reporters and researchers can use to stay informed. We’ll be updating this post as we find new resources.
Dashboards and maps
- The CDC has a coronavirus website with up-to-date information and a national map.
- The WHO also has a webpage dedicated to international events related to coronavirus “as they happen.”
- Google has an interactive map that is updated frequently.
- Penn Medicine has a great hospital impact model (CHIME) that teaches you a lot about the sick, infected, and recovered (SIR) model. Check out the docs.
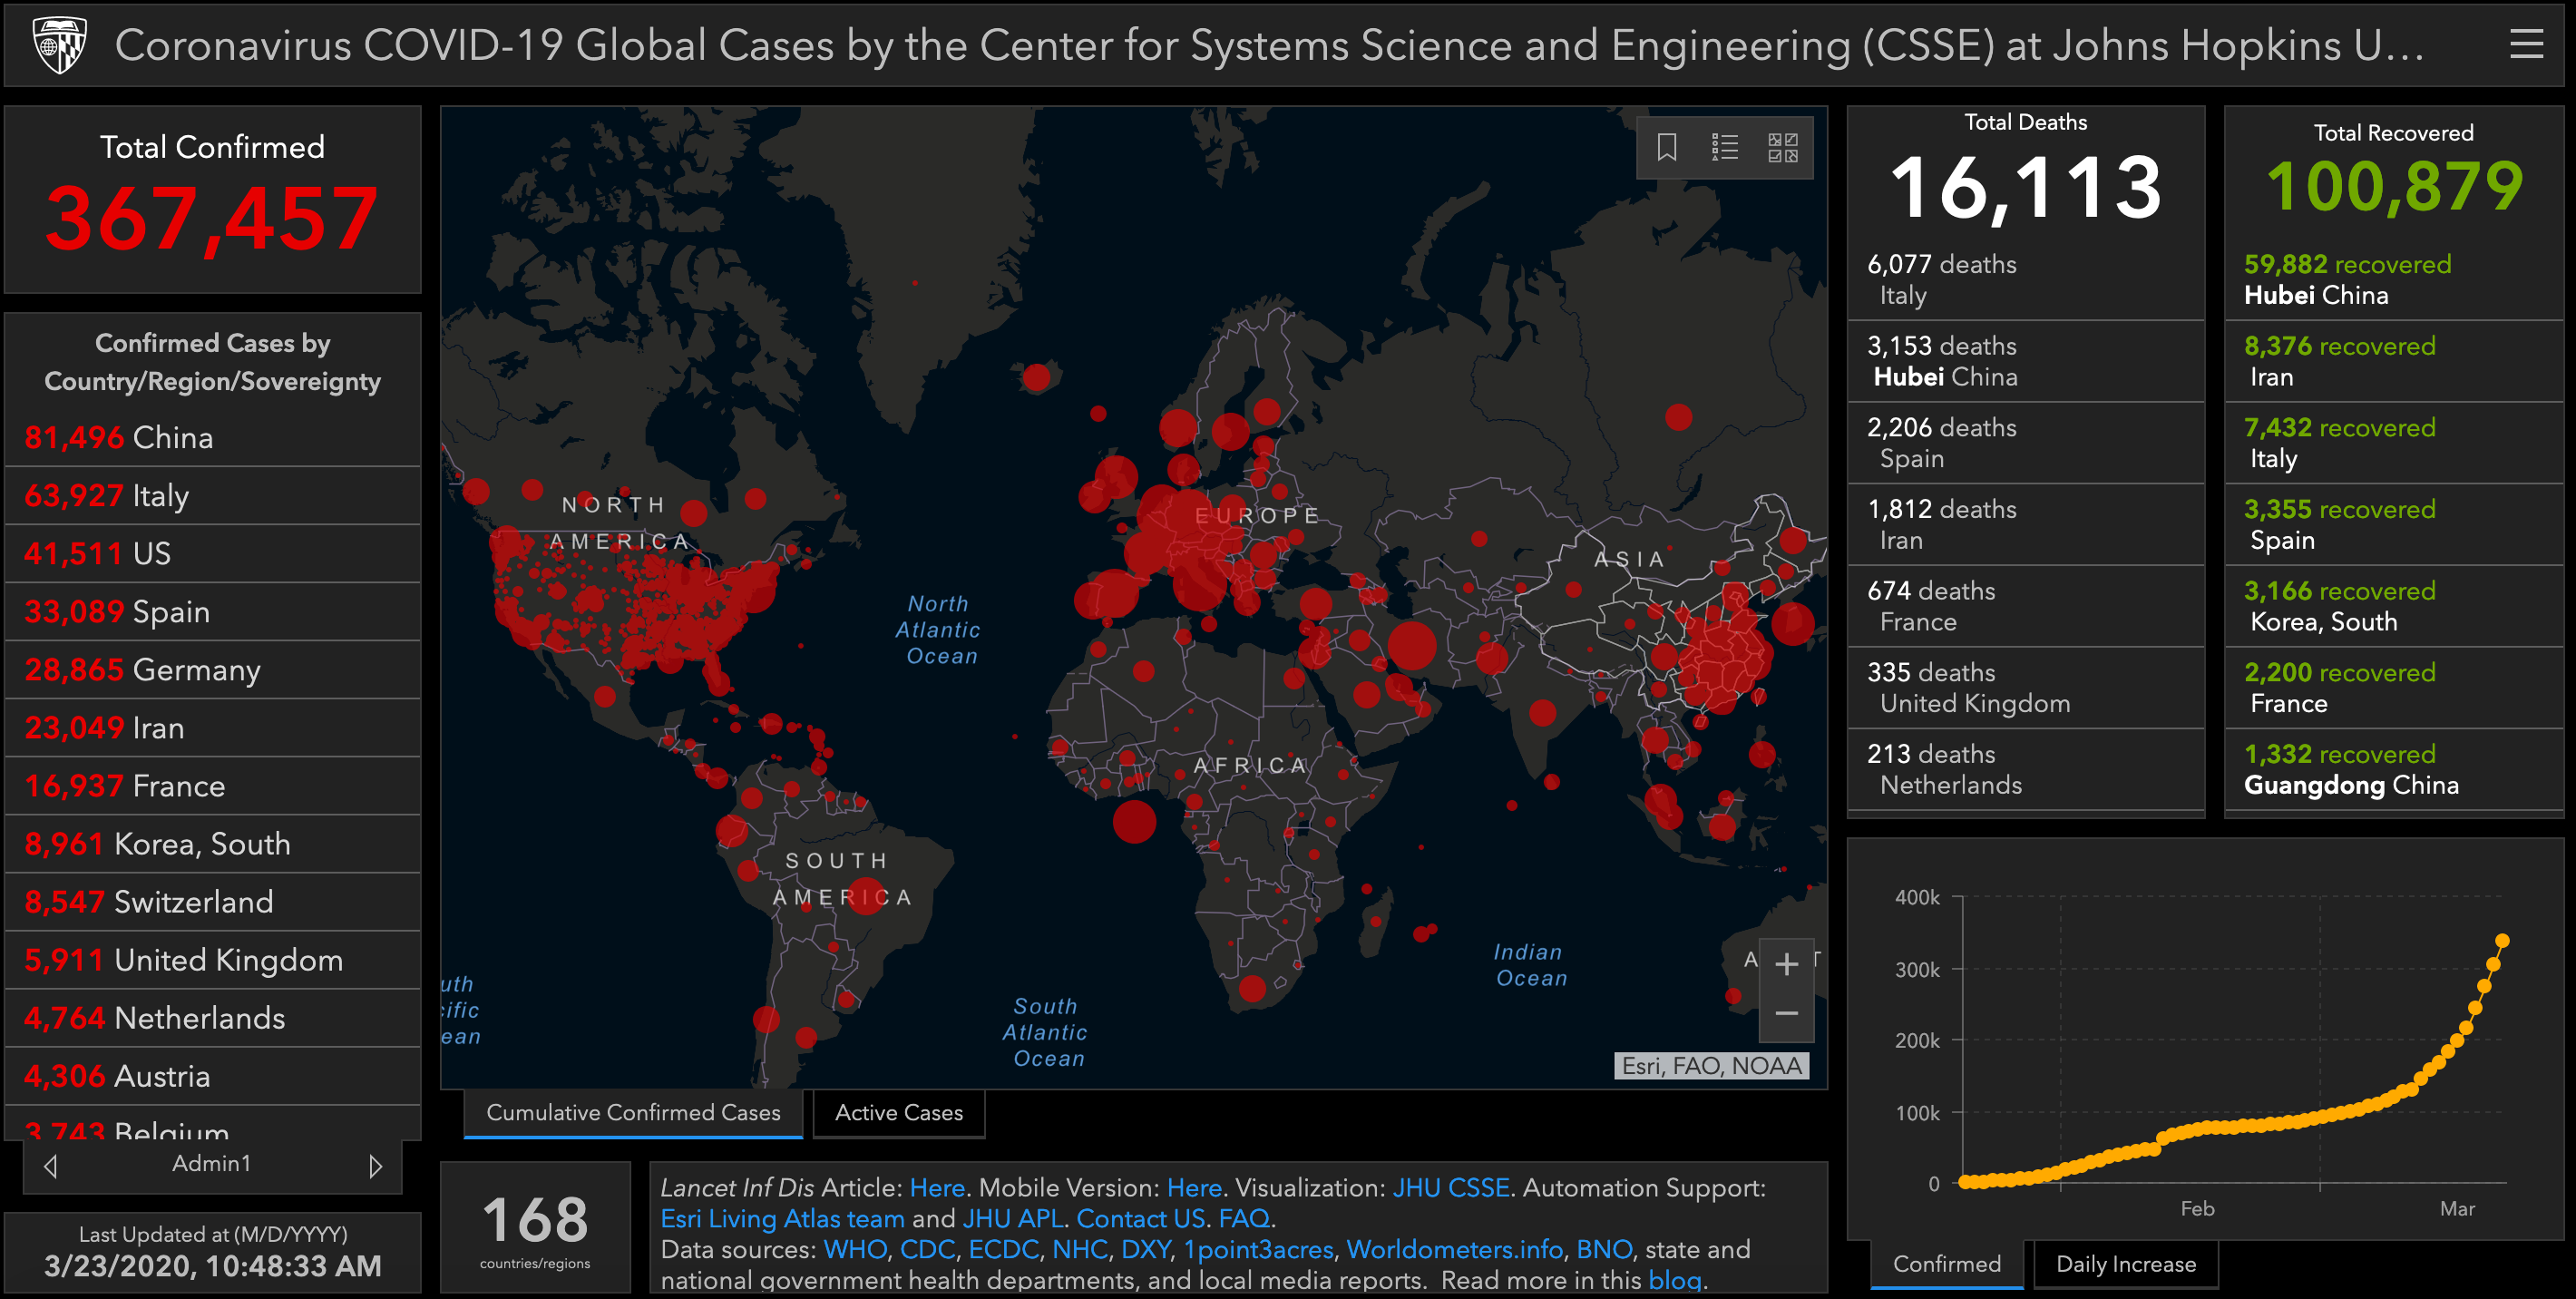
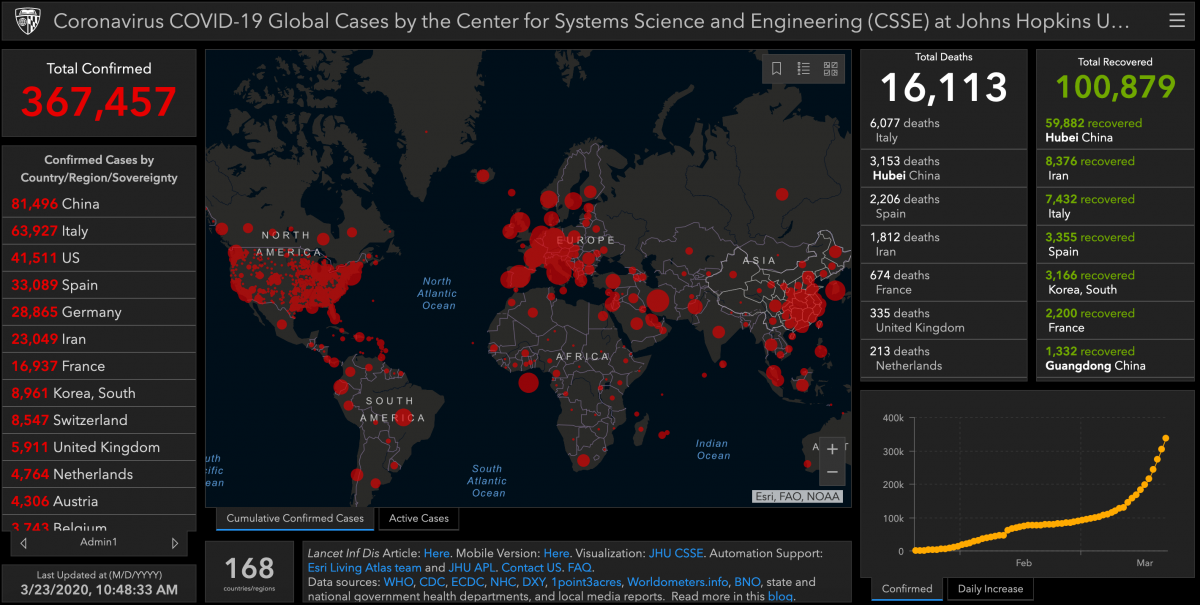
- The Environmental Systems Research Institute (ESRI) has a wealth of dashboards and data, including the Johns Hopkins dashboard (see below and find the mobile version here).
- Antoine Soetewey wrote an excellent blog post on creating a country-specific dashboard with R Shiny.
- At Storybench, we interviewed Northeastern’s Samuel Scarpino, assistant professor at the Network Science Institute, about a map he built tracking the virus.
- The New York Times has a series of maps of the outbreak that it is constantly updating.
- The European Centre for Disease Prevention and Control has a Covid-19 dashboard.
- USAFacts is mapping cases as well. More on their data below.
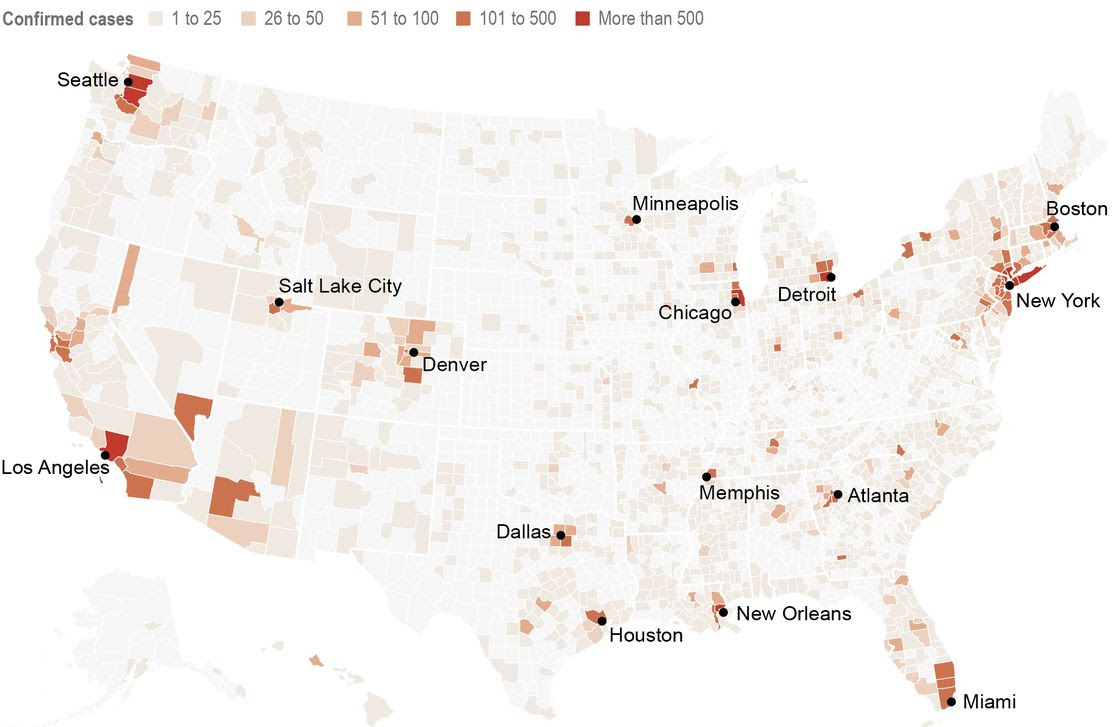
- The Associated Press is updating a map twice daily with infections by county:
Data
- The COVID Tracking Project, a collaboration between The Atlantic, data scientist Jeff Hammerbacher, and a team of volunteers, “collects information from 50 US states, the District of Columbia, and 5 other U.S. territories to provide the most comprehensive testing data we can collect for the novel coronavirus, SARS-CoV-2.”
- The “Science Responds” initiative has a great list of datasets, web scrapers and visualizations related to Covid-19.
- Reddit has a curated list of coronavirus datasets on /r/datasets:

- ESRI also has an area for sharing data on Covid-19.
- Kaggle has also released some new datasets tagged Covid-19, including one with “over 44,000 scholarly articles.”
- The European Centre for Disease Prevention and Control has been publishing Covid-19 data files.
- USAFacts has been gathering state and local public health data on the virus. As BuzzFeed’s Jeremy Singer-Vine points out in his rich Data is Plural newsletter, “USAFacts is using data from state governments, local public health agencies, and Johns Hopkins University to map US cases at the county level, with the underlying data available to download.”
Media
There’s obviously no shortage of media coverage of coronavirus. Here’s a taste of what we’ve been following.
- We’ve bookmarked 538’s articles tagged “coronavirus.”
- There are many veteran science journalists covering Covid-19. A couple you should start following: STAT’s Helen Branswell and Science’s Kai Kupferschmidt.
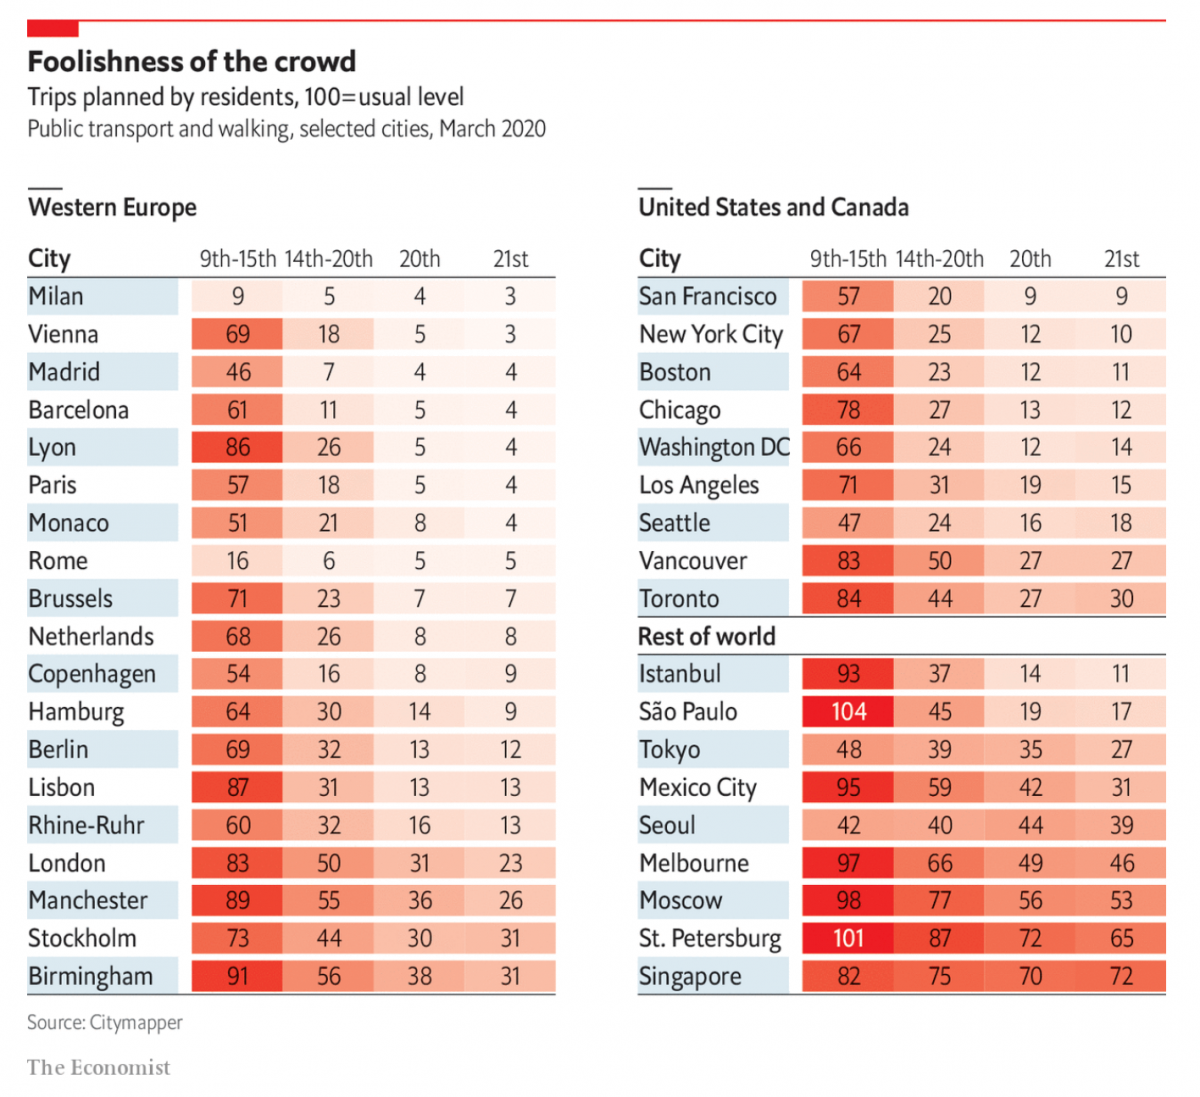
- The Economist’s Graphic Detail is an outstanding place for information:
- Slate is running a “Coronavirus Diaries” series that explores how the virus is affecting lives around the world.
- “How to talk to Covid-19 skeptics” from Undark magazine might help you fight the impulse to barrage skeptics with statistics.
- Stay skeptical with the folks from Science-Based Medicine. They just wrote a great post on the President’s tweet regarding azithromycin and hydroxychloroquine.
Resources
- The COVID-19 Open Research Dataset is a “free resource of over 44,000 scholarly articles, including over 29,000 with full text, about COVID-19 and the coronavirus family of viruses for use by the global research community.”
- If you’re looking to brush up on some of the terms being thrown around in the media, we recommend the following resources:
- Here is an introduction to epidemiology course from CDC,
- The British Medical Association’s BMJ has a tremendous online text “Epidemiology for the uninitiated.”
- If you have a ton of free time, kick back and browse the lectures on SuperCourse: Epidemiology, the Internet, and Global Health
We will keep posting more resources as we learn about them. If you know of any, please leave them in the comments!
Latest posts by Martin Frigaard (see all)
- Getting started with stringr for textual analysis in R - February 8, 2024
- How to calculate a rolling average in R - June 22, 2020
- Update: How to geocode a CSV of addresses in R - June 13, 2020
