DataBasic: A new suite of tools for working and telling stories with data
How many times has the president used the word “innovation” in the State of the Union speech? How different are those speeches across presidencies? And how do I start to decipher a complicated spreadsheet with columns and rows full of numbers? Enter DataBasic, a new suite of easy-to-use tools for working with and pulling stories out of data that is built for beginners but valuable to data storytelling veterans.
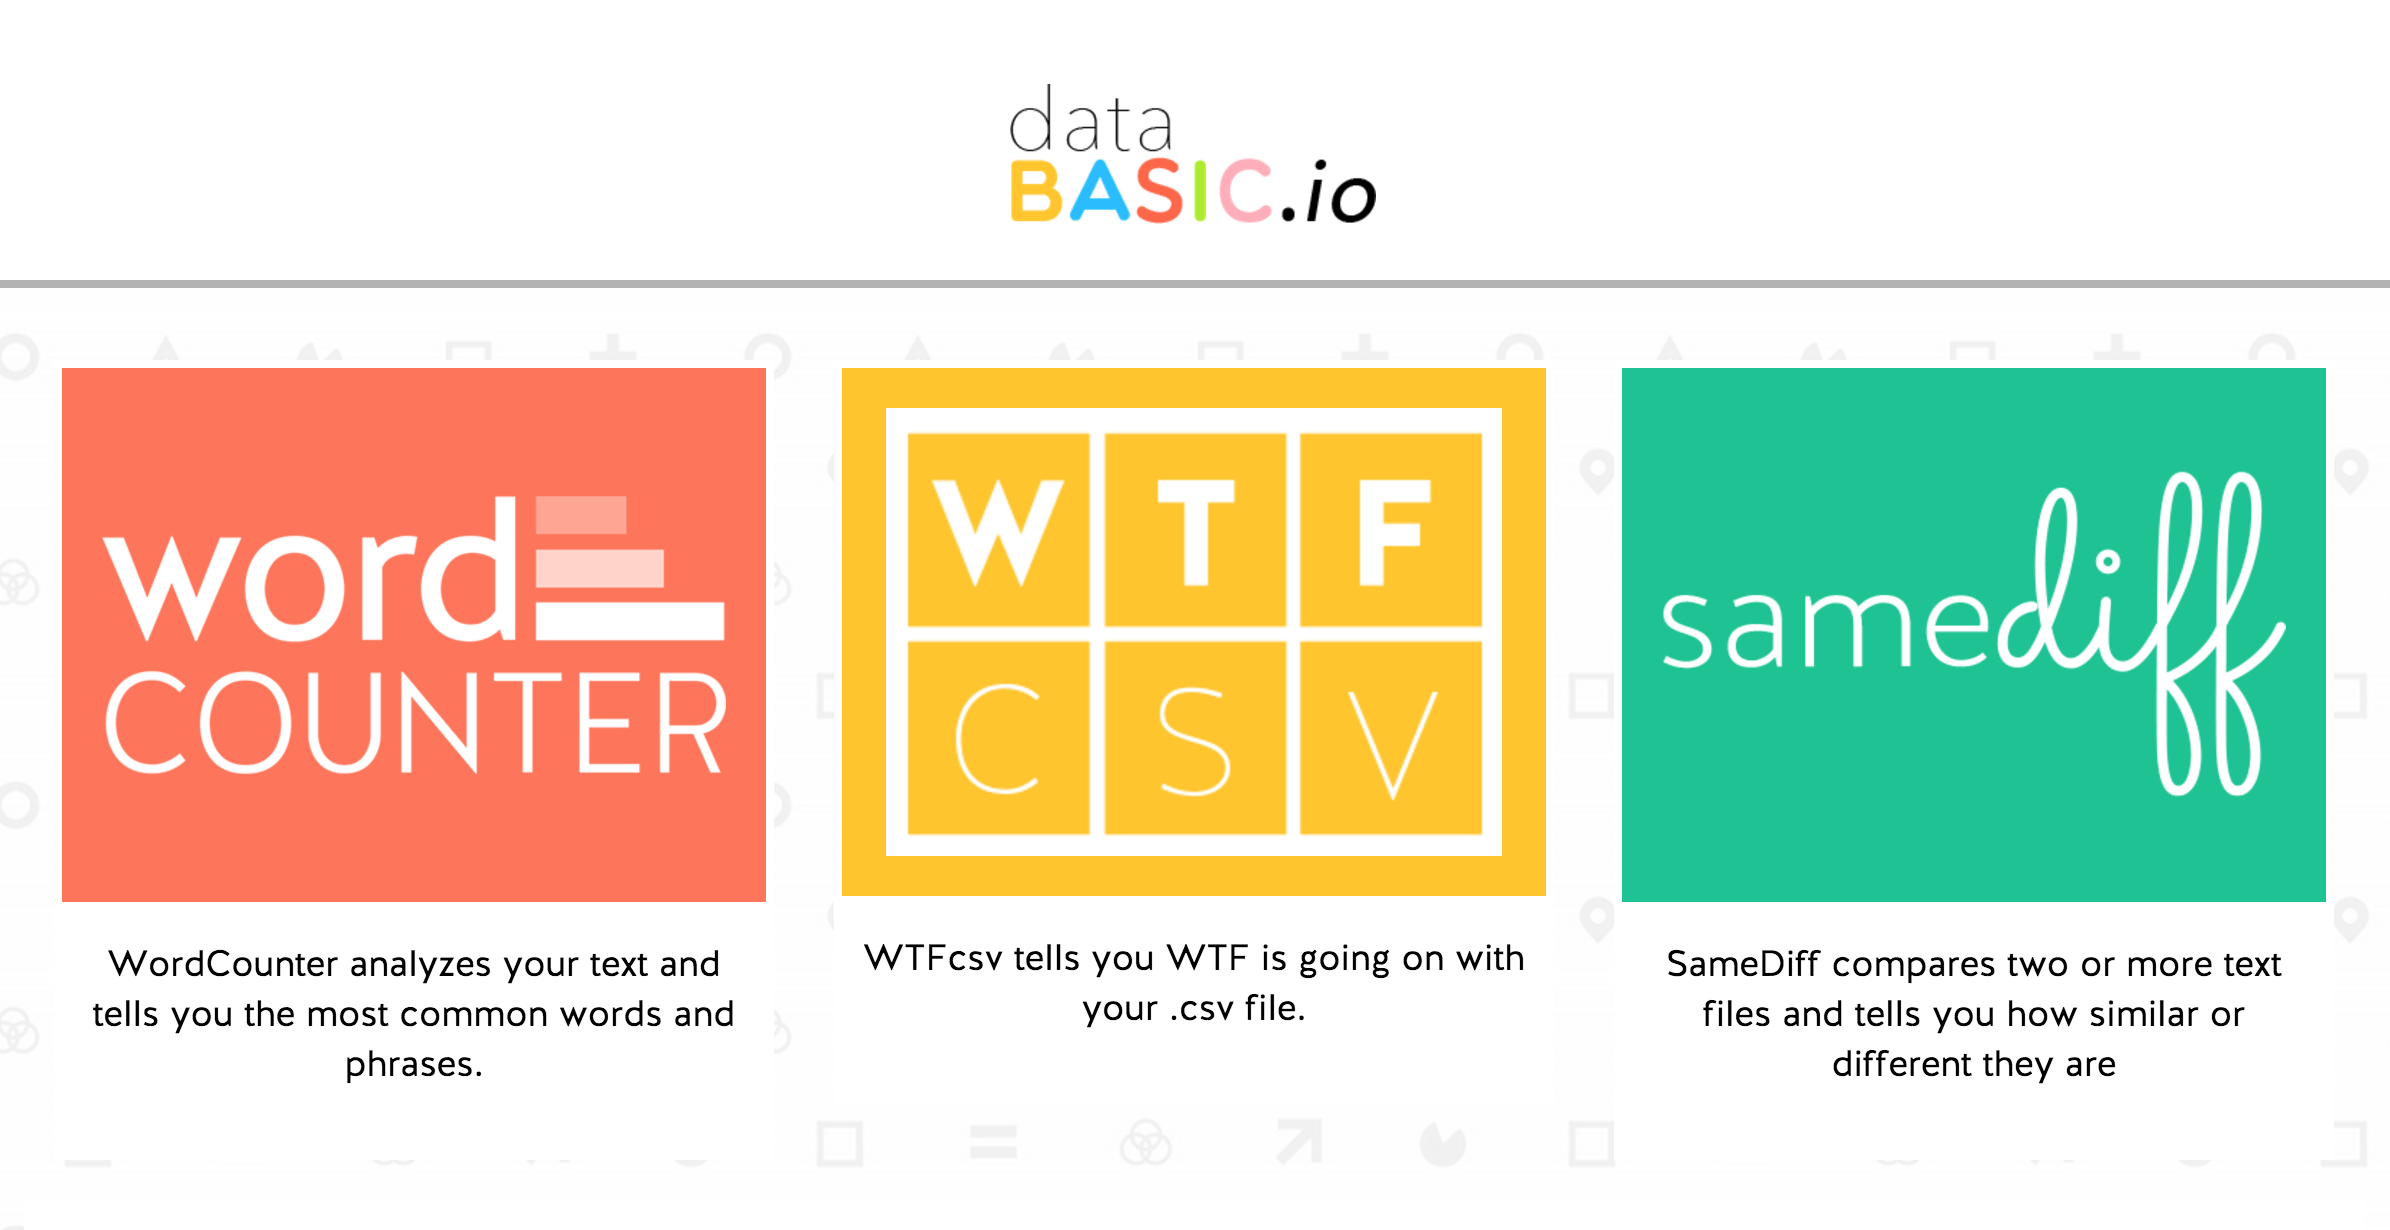
DataBasic includes three tools: WordCounter, SameDiff, and WTFcsv. WordCounter performs simple textual analysis to count word frequency as well as list common words and phrases in your text. SameDiff compares text files and finds words that are common to both files. Finally, WTFcsv unpacks and simplifies whatever spreadsheet you upload.
DataBasic is built by Catherine D’Ignazio, a journalism professor at Emerson College, and Rahul Bhargava, a researcher at M.I.T.’s Center for Civic Media, with funding from the Knight Foundation Prototype Fund. Storybench asked D’Ignazio a few questions about DataBasic. Read through and then be sure to play with the tools here.
Where did you two get the idea for DataBasic?
The idea came from our experience teaching data storytelling in the classroom, seeing the roadblocks in student learning and gaps in the tool space. We also did an analysis of more than 500 tools to get a sense of what tools are out there (there are so many, just navigating that complexity is challenging).
Do you know we actually built WordCounter after reading Storybench’s post about the word counting assignment? We tried using the tool you all described with our students but it was clunky and we felt we could do a better job of making it accessible, fun and learner-friendly.
How were the tools coded?
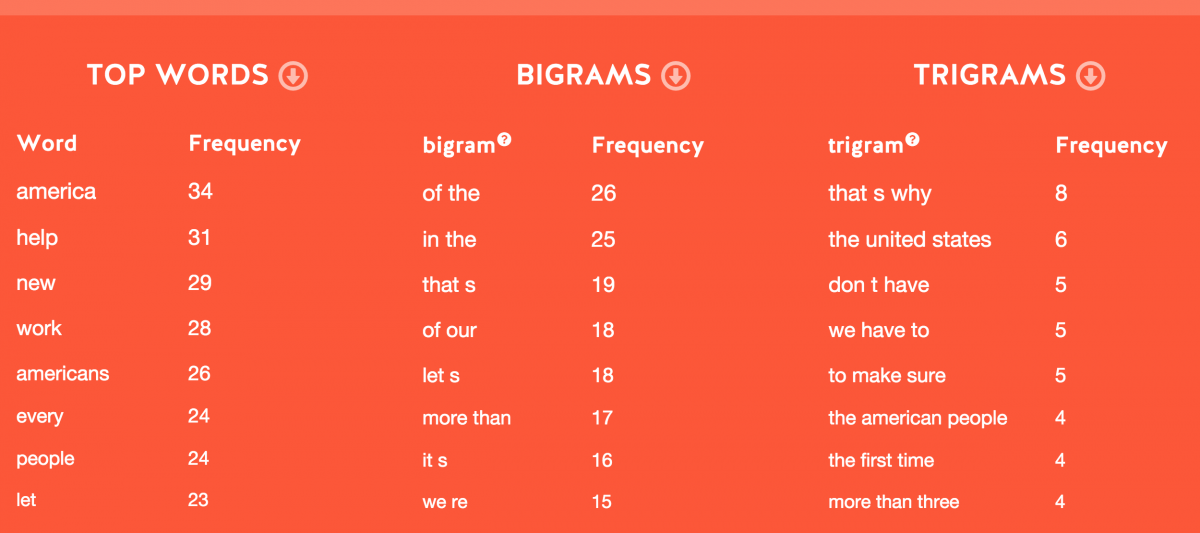
We coded the first prototype of each tool to get the idea straight and make sure that we were adhering to our design guidelines. We did have to do a couple iterations. For example, SameDiff was way too complicated the first iteration. We had to pare it down to make it work. WordCounter, for example, takes uploaded text and then uses python’s natural language processing toolkit to count word frequencies, bigrams (two-word phrases) and trigrams (three-word phrases). This is something that is pretty easy in code, but if you don’t write code it’s not available as a tool for you!
What kind of feedback have you received from your focus groups?
Very positive from both seasoned data folks and from relative newbies. We had people from policy, non-profits and community advocacy groups, news organizations and students at the workshops and had very positive feedback. One of the most interesting things was that people left feeling much more comfortable doing quantitative analysis of text (something that WordCounter and SameDiff helps you do).
What new, unintended applications have arisen?
One financial reporter said she was going to use SameDiff to compare public conference calls about SEC filings. Another said he would use it to compare political speeches. One activist said he wanted to use it to compare different media coverage of his homeland. Many folks thought that WTFcsv was immediately useful in their work when they start out looking for patterns in a spreadsheet.