How Scientific American makes its infographics
Flip through the pages of a scientific journal and you’ll find numerous figures, charts, and diagrams visualizing important scientific discoveries. But interpreting those visuals may leave you scratching your head. It’s important to remember that scientists present their data in ways that their fellow scientists can comprehend. Technical jargon and statistical error bars can efficiently communicate the legitimacy of a scientific breakthrough to a scientific audience. However, these same features can be both confusing and distracting when presented to a wider audience. For the public to be excited and informed about the latest scientific breakthroughs, technical data visualizations need to be transformed into engaging visual stories that a wider community can understand.
Jen Christiansen is someone who makes those transformations happen. As the art director of information graphics at Scientific American, she is in charge of turning scientists’ figures, charts, and diagrams into the publication’s award-winning science infographics.
“I’ll see a visualization [in a scientific paper] that looks like there’s a really interesting punch-line or dataset involved, but could really benefit from a makeover,” explained Christiansen in an interview with the podcast Data Stories.
So what does it take to successfully reimagine a scientific visualization as a popular infographic? Storybench spoke with Christiansen to learn more about her creative process and how she brings together scientists and visual communicators.
The birth of an infographic
Developing the concept for an upcoming Scientific American infographic starts with understanding the science. As Christiansen described on Data Stories, most of her infographic ideas are initially drawn from reading proofs of Scientific American’s upcoming feature articles.
“I’ll read through the manuscript and figure out something that would be better told in images than words,” she says. “Not necessarily better, but just more efficient at giving background information or broadly explaining things.”
Asking for visual materials from sources and writers
But it’s not only the text that gets Christiansen’s ideas churning. At the very beginning of the process, she and the text editors ask the authors of the manuscript, some of which are scientists, if they can send any visual materials her way.
“Usually, it’s sort of, ‘Send us whatever you got and we will see,’ ” she says. As a result, Christiansen has received everything from PowerPoint presentations to full scientific articles, even hand-drawn sketches. “Sometimes, when going through the material, something pops out that may not have hit me when reading the manuscript. We’re like, wow, this concept is really cool and [the scientists] have already started to problem solve how to convey this visually.”
After referencing the visuals and making notes on the manuscript, Christiansen, along with the full art department and editing team, maps out the visuals for the whole feature article. “We figure out what is the story we need to tell and how do graphics fit into that…It’s at that point that I start to think more about artist and data visualizing matches.”
Finding the right artist
There are three things Christiansen takes into account when finding a graphic designer or data visualization expert to bring her infographic concepts to life: content, aesthetics, and technical skill. To find a good content match, Christiansen looks for an artist that has an area of expertise that matches the content of the article. This is important because an artist who has a background, for instance, in microbiology is usually more efficient at visualizing biological information than an artist with little background knowledge on the topic.
“They already know the basics, so I don’t have to worry about providing them information for every detail…we’re just concerned then with adding the new information,” Christiansen explains.

Want to breaking into the field of scientific illustration?
Christiansen has a tip for you: “I’m always looking for artists that understand physics, quantum physics, and some of the more theoretical sciences. There are real opportunities to illustrate [physics] concepts and I’m not really seeing as many artists who are jumping into that in comparison to other genres.”
Background knowledge, however, isn’t everything. The second criterion is finding an artist who is a good aesthetic match. “If I want a certain look or a certain feel to the piece and there are a lot of people who are a good content match, I’ll start to think if this is a kind of a serious piece, we don’t want to have a playful style, we want something a little bit more subtle and elegant.”
Lastly, Christiansen takes into account the technical skills of the artist. The larger the dataset, the more important it is for the artist to know how to design with code. On the other hand, if the dataset is small and Christiansen is looking to customize and “hand tool” a design, then she may go with someone who is very fluid in a program like Adobe Illustrator. A sure way not to get hired by Christiansen is to miss deadlines. “I generally drop [those] from my contacts list.”
Getting the facts right
From concept to the final product, it is important for Christiansen that the graphics accurately portray the science. This is especially true when an idea for an infographic isn’t generated from the manuscript of a feature article, but rather from a dataset in a scientific paper. There have been times when Christiansen has directly downloaded a scientific dataset from an open access paper and given it to a data visualization expert to work with. But, as she emphasized, “It’s one thing to have access to the information, it’s another thing to actually interpret and show it correctly.” Therefore, when developing the data visualization, they ask the authors of the paper to review their drafts of the visualization and ultimately, their final graphics for accuracy.
Christiansen and the team at Scientific American have had good luck when reaching out to scientists or a team of authors on a paper. Many of them are very generous in sending us data. As Christiansen further illustrated, “In some cases, they’ll say ‘Oh, we put up one data set, but let’s give you another one that we’ve already applied a few filters to’. So sometimes even if the raw data is out there, just by contacting the scientists, we’ll get a dataset that’s a little easier to work with.”
From data-gathering to finishing touches
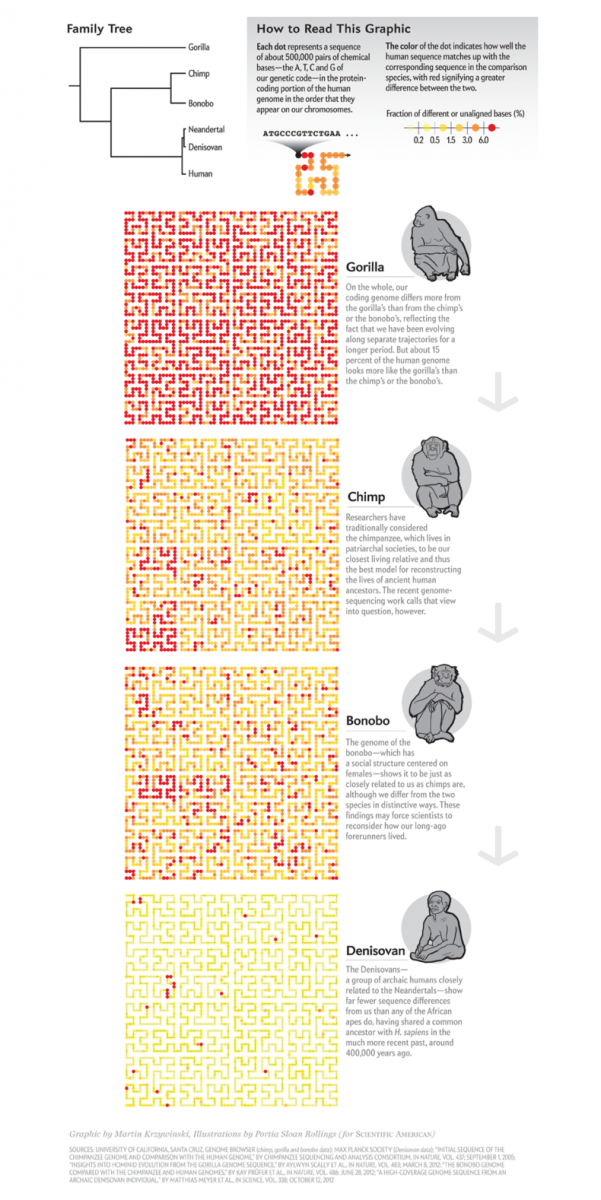
Martin Krzywinski is a freelance illustrator who in September 2014 tackled a difficult proposal from the Scientific American editors. The challenge was to visualize the differences between primate genomes and the human genome, all in a five inch by five inch space in the magazine.
After trying to visualize the genomic data in various circular layouts, Krzywinski ended up using a square. As he put it for a Scientific American blog post, “the question is how do you pack a genome (a one-dimensional object) into a square (a two-dimensional object)? The answer is a space-filling curve, such as a Hilbert curve.”
Krzywinski told Storybench about the importance of knowing what message one wants to deliver with an infographic.
“The message of the graphic, as well as the audience, must be agreed upon. It’s not enough to merely ‘show the information,’ ” he wrote in an email. “The designer must realize that things are always more complicated than they seem. Particularly in any biological science. Moreover, any kind of catchy headlines like ‘we share 99 percent of DNA’, while not entirely wrong, are ultimately useless because they tell people nothing. Journalists must dig for surprising, engaging stories that reveal and manage complexity to
the reader.”
The following is the finished product, a scientifically accurate representation of the genetic differences between apes and humans.
It’s a team effort
The successful completion of an infographic often relies on Christiansen developing a good working dynamic between the artists and scientists.
“It works best if everyone does a little homework before the first encounter,” she says. For the designers, Christiansen suggests that they gain a baseline understanding of the scientific topic being visualized. At the very least, she recommends doing some basic web searches, reading the primary source article, having questions ready, and maybe completing a rough concept sketch. For the scientists, she emphasizes the importance of gathering relevant visuals and thinking of alternative ways to explain the concept, like metaphors.
One of the biggest challenges Christiansen encounters on the job is when a scientific concept doesn’t lend itself to being illustrated. For example, something that takes place beyond three-dimensional space. “But every once in awhile, everything comes together. The scientist uses a metaphor that really works well for a visual, and the artist grabs on to that metaphor and they figure out how to make that work visually. So sometimes I think the greatest challenges end up being the things that are most exciting when they get solved.”
Christiansen’s own blog posts on the development of specific Scientific American infographics, including the ones on the origins of Earth’s oceans and dampening pain signals, highlight the importance of having input from both scientists and artists during the design process.
Future collaborations
The collaborative workflow at Scientific American could serve as a potential model for providing the public with more science-related visual stories with which to engage. Recently at Storybench, we highlighted two successful partnerships between academics and journalists in visually communicating complex concepts to a wider community. Together they were able to produce appealing interactive infographics informing the public about bacteria in New York City’s subways and cancer risk in the workplace.
Scientists could also independently reach out to freelance visualizers to repurpose their own scientific visualizations into public-friendly infographics.
Scientists at the University of California at San Francisco, for example, worked directly with the data visualization firm Periscopic to create the interactive “A Model of Breast Cancer Causation” based on the scientists’ published mathematical model.
Even skilled designers eager to work with interesting datasets could reach out to researchers to access their wealth of information. Designers like David McCandless from Information is Beautiful frequently does this. As Christiansen describes, “When you do come up with a visual solution as part of a team… that’s exciting.”
[For more behind the scenes with a Scientific American illustrator, read the Storybench interview with Emily Cooper.]
- How Scientific American makes its infographics - September 11, 2015
- How Bacteria in New York City’s Subways Brought Scientists and Journalists Together - April 15, 2015