How to install and brand your own version of Chartbuilder
George LeVines is digital editor at Defense One. After customizing an installation of Chartbuilder for that newsroom, he agreed to write out a tutorial for Storybench.
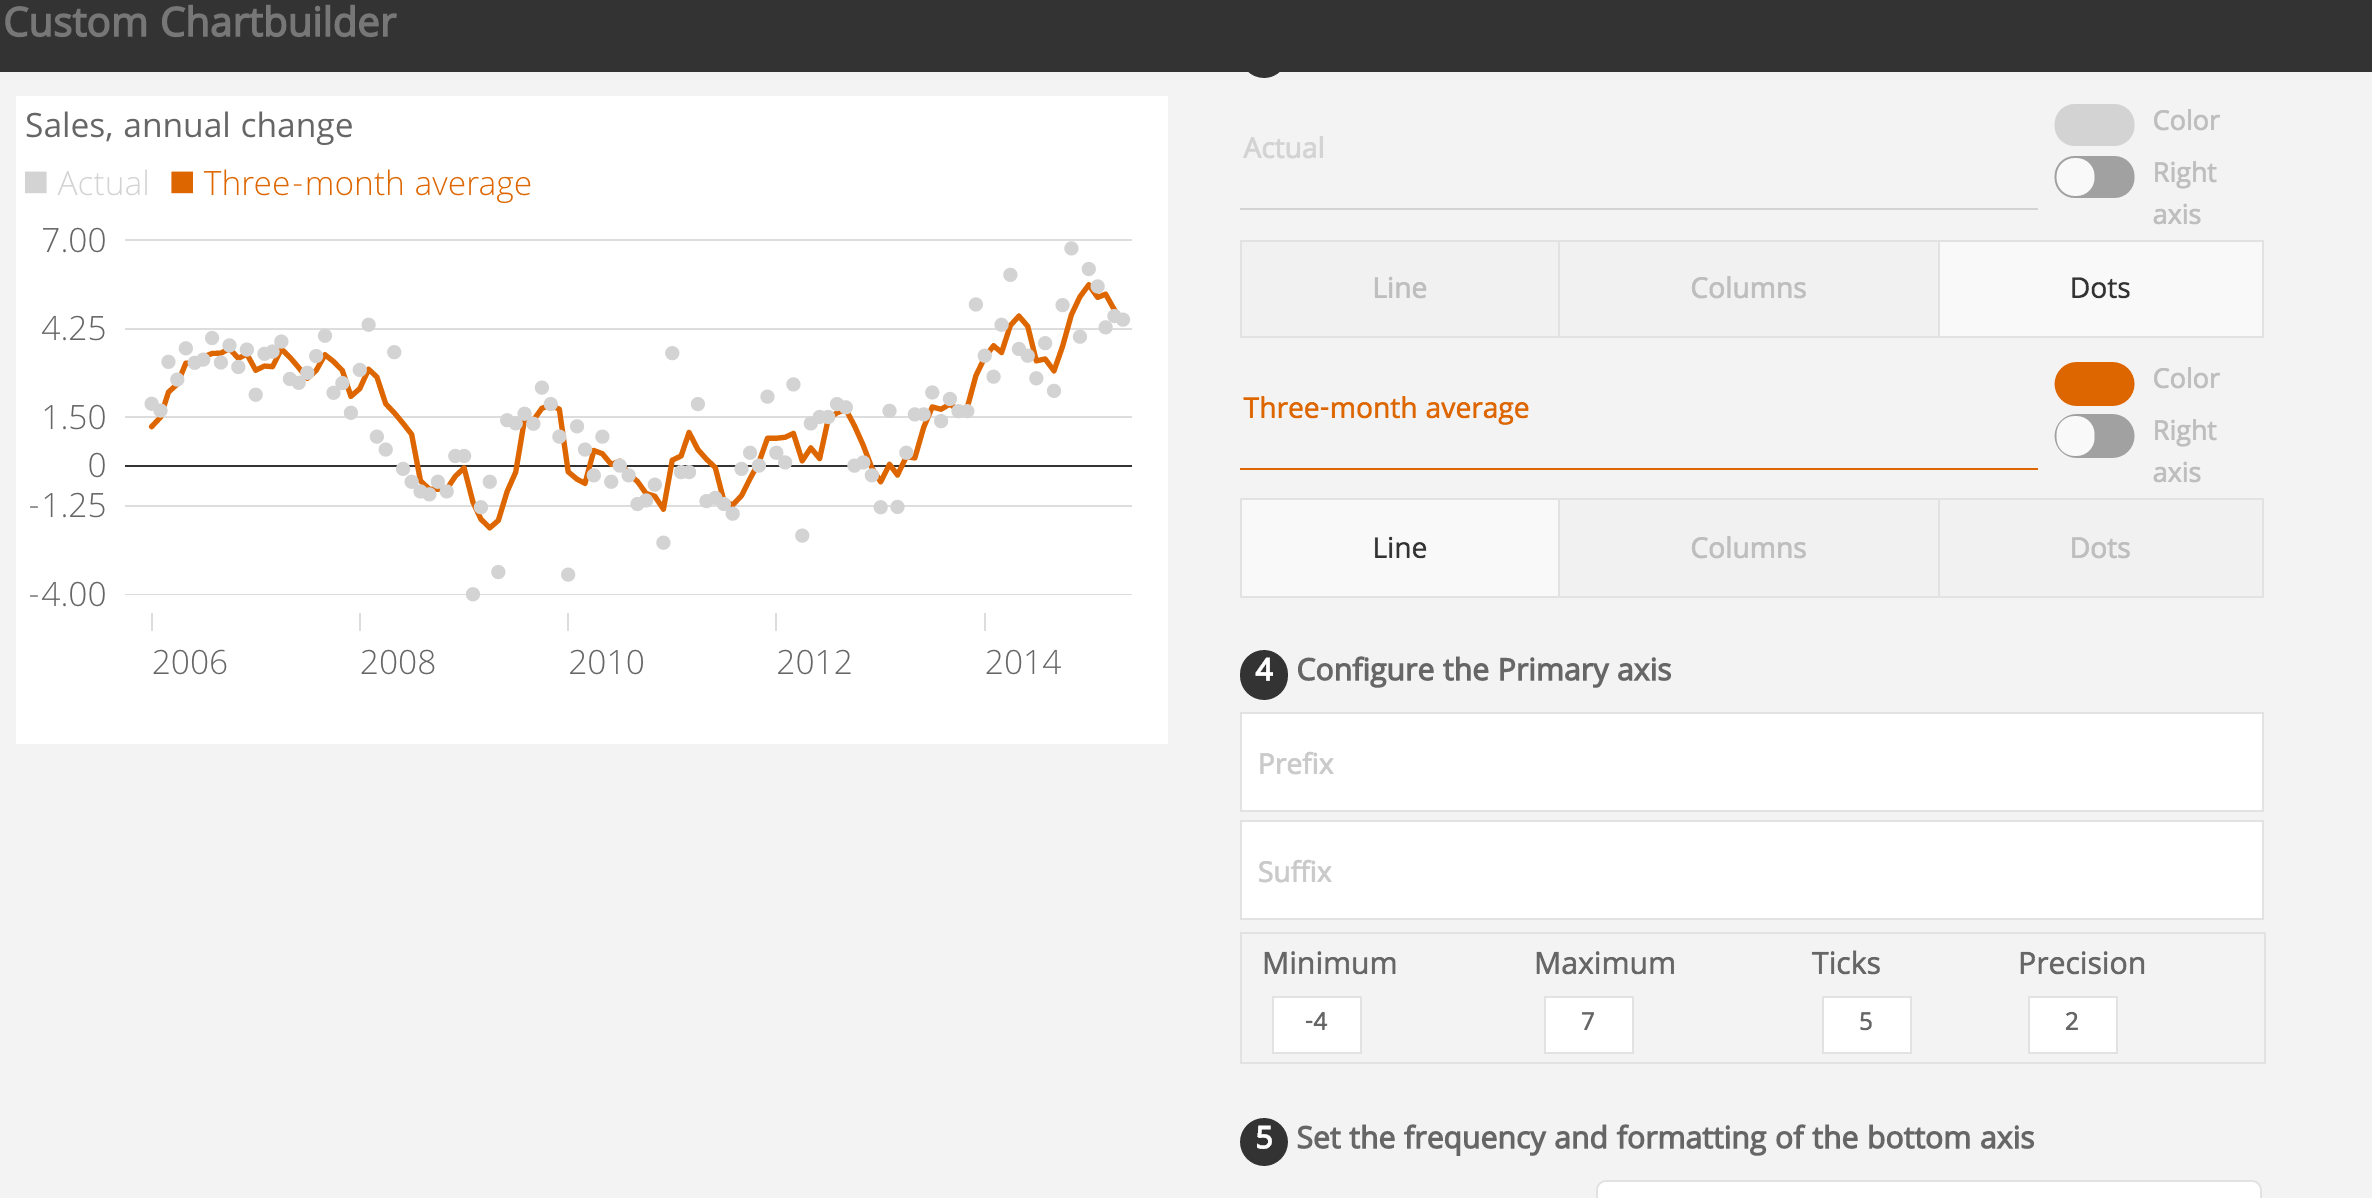
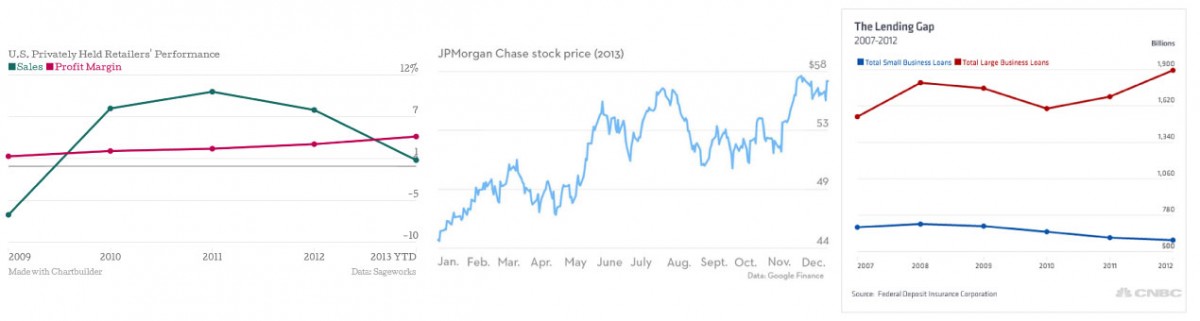
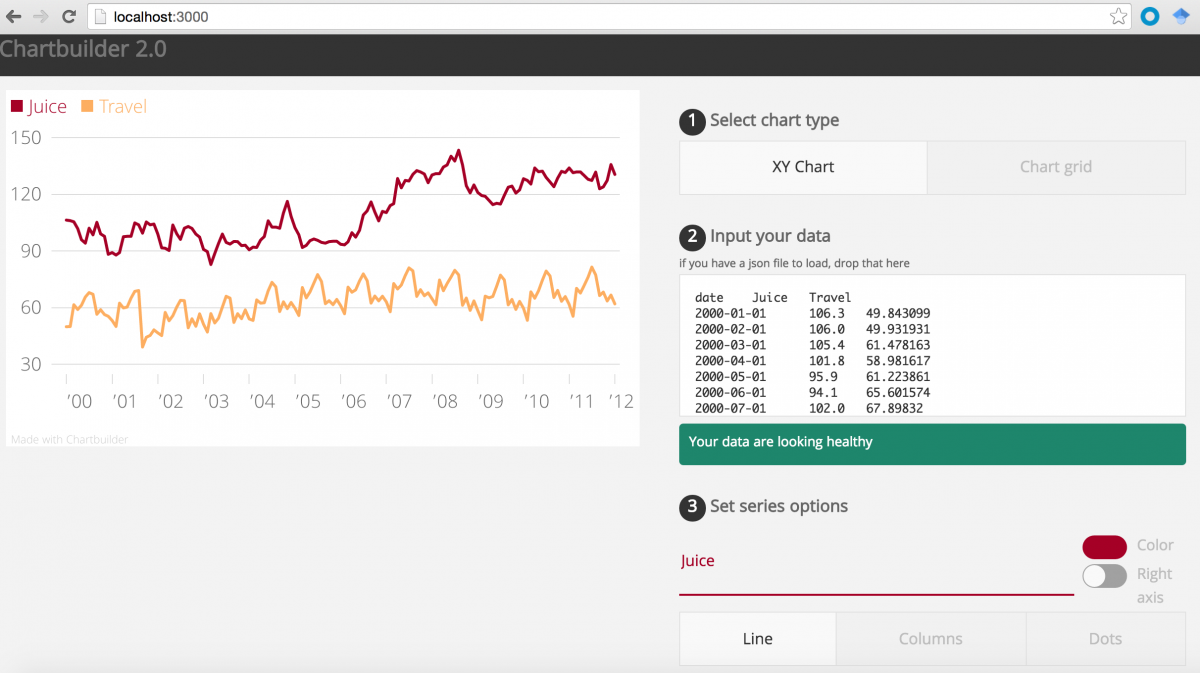
Chartbuilder is an out-of-the-box chart and graph creation tool built by Quartz that they graciously open sourced to the news community. Dozens of news outlets–like NPR, The Wall Street Journal, CNBC, and Digiday–have used it in their newsrooms to create branded charts and graphs. Storybench has published several Chartbuilder tutorials, including How to organize your data for various graphs and charts. The following is a tutorial for building your own branded Chartbuilder.
Make sure you have everything required to build a Chartbuilder of your own
- You’ll need a text editor to edit code. Sublime Text 3 is good because it supports Babel, a package that helps color code the .jsx files that Chartbuilder uses. Learn how to install Babel for Sublime Text 3 here.
- You’ll need to download node.js. (It’s only 40 MB.)
- You’ll need to open your local computer’s command line interface. On a Mac, this is called Terminal and it’s in the Utilities folder under Applications.
Download all the Chartbuilder files from Quartz
You can download this to your local computer a variety of different ways, the fastest being the git clone function. First, fork the Chartbuilder repository from Quartz to your own repo. This way you won’t be working on their original repository. Then, on the command line, type git clone https://github.com/YOUR-REPO-HERE/Chartbuilder.
Install Chartbuilder’s dependencies with one command
Navigate to your Chartbuilder folder in the command line. The easiest way to get there on Mac is to type cd, drag the downloaded folder to the Terminal window and hit Enter. It will input the path for you.
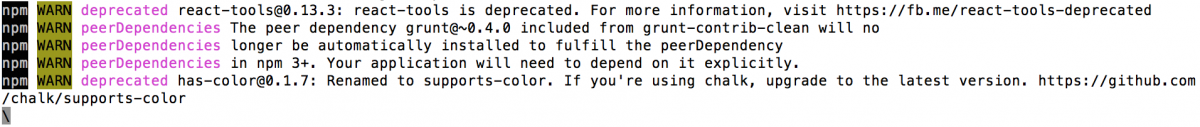
Once inside the Chartbuilder directory, install dependencies in one go by typing npm install and hitting Enter. This may take between five and ten minutes to install.
It should start like this…
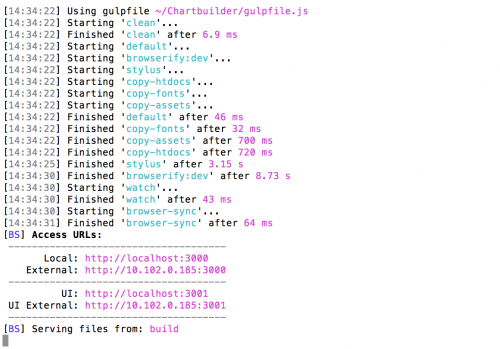
… and end like this.

Congratulations, you’ve installed Chartbuilder locally and now you can start customizing it!
Run Chartbuilder locally
To boot up the Chartbuilder installation on your local computer, type npm run dev.
Then, point your browser to http://localhost:3000/.
Start developing!
Below are step-by-step instructions for customizing every aspect of Chartbuilder, from the title to the fonts to the colors. Get creative!
Title
Change the display and page title at Chartbuilder/src/htdocs/index.html
<!DOCTYPE html>
<html>
<head>
    <meta charset="UTF-8" />
    <meta name="viewport" content="width=device-width" />
    <meta http-equiv="X-UA-Compatible" content="IE=Edge" />
    <title>George's Charts - A Chartbuilder Fork</title>
    <link rel="stylesheet" href="css/main.css">
    <link rel="shortcut icon" href="favicon.ico" type="image/x-icon" />
</head>
<body>
    <div class="header">
        <h1>George's Charts</h1>
    </div>
    <div class="chartbuilder-container">
    </div>
    <script src="js/main.js"></script>
</body>
</html>
<title> changes the page title and <h1> changes the displayed title.
Save.
Typography
Getting Google’s webfonts to work with @import or even a link reference in <head> was a total nightmare so I went with downloaded fonts. (This might have something to do with Chartbuilder converting all fonts to base64. Also, it might not.)
Create a directory fonts in Chartbuilder/src/ and dump whatever fonts you plan to use in there. I’m using Open Sans from Google.
Open Chartbuilder/src/styl/fonts.styl and call your fonts like so:
@font-face {
font-family: 'Open Sans';
font-style: normal;
font-weight: 400;
src: url('/fonts/Open_Sans/OpenSans-Regular.ttf');
}

@font-face {
font-family: 'Open Sans Bold';
font-style: bold;
font-weight: 700;
src: url('/fonts/Open_Sans/OpenSans-Bold.ttf');
}

@font-face {
font-family: 'Open Sans Light';
font-style: normal;
font-weight: 300;
src: url('/fonts/Open_Sans/OpenSans-Light.ttf');
}
Keep the old references or don’t. (Probably don’t).
Save.
Open Chartbuilder/src/styl/type.styl and use your new fonts:
// Typography

// Fonts
$font-sans = 'Open Sans', sans-serif
$font-sans-light = 'Open Sans Light', sans-serif
$font-sans-bold = 'Open Sans Bold', sans-serif
$font-serif = Georgia,'Times New Roman',Times,serif
$primary-font-family = $font-sans
$secondary-font-family = $font-serif
$monospaced-font-family = Monaco, Lucida Console, monspace
Save.
Apply a new font specifically: Open Chartbuilder/src/styl/layout.styl
Find h1 under .header and add font-family $font-sans-bold so it looks like this:
.header
        background-color #333
        margin-top 0
        top 0
        position fixed
        height $header-height
        width 100%
        z-index 10000
        padding 0.5em 0 0 0.25em
        h1
            color #777
            margin 0
            line-height 1
            padding 0
            font-family $font-sans-bold
Save. Look, now your title bar is bold.
I don’t like the way the ‘light’ version of Open Sans looks, so we’re going to mostly remove it from the chart. That happens at Chartbuilder/src/styl/chart-renderer.styl. Compare my version with the Chartbuilder master version. (Hint: Don’t worry about the missing .svg-text-sub that’s only present if you want to add a subtitle to your Chartbuilder.)
I like the way uppercase looks for my credit and source information. Again in Chartbuilder/src/styl/chart-renderer.styl under &.svg-text-credit and &.svg-text-source add text-transform uppercase to each like so:
  &.svg-text-credit // Customize credit text
    font-size $em_size*0.6
    fill $color-chart-meta
    text-anchor start
    text-transform uppercase
  &.svg-text-source // Customize source text
    font-size $em_size*0.6
    fill $color-chart-meta
    text-transform uppercase
Save.
Colors
Colors are all handled at Chartbuilder/src/styl/colors.styl. As mentioned in the documentation, Chartbuilder needs to know how many colors are being used in the chart. If you don’t need more than 11 colors, perfect. Swap out hex values to your hearts content from the list under $chart-colors =\. Changing anything in this file before $chart-colors =\ will affect a variety of elements in the Chartbuilder interface and on the chart itself. Everything with a $ is a variable in Stylus, so search through the files to determine exactly what color variables are assigned to what. (Much of it can be found in the/chart-renderer.styl sheet mentioned earlier.)
Note: Chartbuilder relies heavily on SVG to work its magic. The CSS property color and many other normal CSS properties (such as background) do not function as expected. When you’re looking at elements in your browser inspector, the color of the element will instead correspond to the fill property. Folks new to SVG (like me) will find this SVG documentation useful.
Adding colors
If you must have more than the default 11 colors, here’s how:
Get your list of colors finalized. Count how many colors you have. Open Chartbuilder/src/js/config/chart-style.jsand find numColors:. Change the number to correspond with the counting performed earlier.
Formatting
It’s worth noting here that for most tweaks made not encompassed by .styl sheet changes, we’ll often have to make 2 or more changes one for each of Chartbuilder’s chart type iterations (namely, the default xy and the grid types). This will be the case for most anything that involves positioning elements around on the chart.
XY CHART FILES
Chartbuilder/src/js/charts/cb-xyChartbuilder/src/js/components/chart-xy
GRID CHART FILES
Chartbuilder/src/js/charts/cb-chart-gridChartbuilder/src/js/components/chart-grid
Note: There are general files that apply to all chart types within both Chartbuilder/src/js/charts/ andChartbuilder/src/js/components/.
PADDING
Chartbuilder doesn’t come with much space around the edges. Let’s add some padding. To fix the padding we’re going to pull up Chartbuilder/src/js/charts/cb-xy/xy-config.js and Chartbuilder/src/js/charts/cb-chart-grid/chart-grid-config.js.
In each file find margin: and set the desired margins. I went for …
margin: {
        top: "0.85em",
        right: "0.5em",
        bottom: "0.5em",
        left: "0.5em"
    },
… in xy-config.js and …
margin: {
        top: "0.9em",
        right: "0.5em",
        bottom: "0.5em",
        left: "0.5em"
    },
… in chart-grid-config.js which behaved slightly different at the top.
Adding a logo
(H/T to @petulla for this one.)
Most folks are going to want their chart branded. Here we’ll add a logo in the bottom left corner.
Add your logo file to src/assets/. Don’t worry too much about size at the moment, it will get adjusted later.
Open Chartbuilder/src/js/components/svg/ChartFooter.jsx. There’s a lot of changes here so I’ll link to the actual commit. There are two important areas to note here for further tweaking:
- Lines 99-101, where the
+ 30dictates the offset distance of the credit text from the left side of the chart. - Lines 139-142, which dictate the size of the logo and where the logo file itself lives, should you need to change that.
Once you’ve made all the changes in the aforementioned commit, save.
Next, create the file SvgImage.jsx in Chartbuilder/src/js/components/svg/. Add the following contents to that file:
// Svg image elements used to annotate chart
var React = require("react");
var PropTypes = React.PropTypes;
var ChartViewActions = require("../../actions/ChartViewActions");

/**
 * An Svg <image> element with width and height
 * @instance
 * @memberof RendererWrapper
 */
var SvgImage = React.createClass({

    propTypes: {
        className: PropTypes.string,
        onUpdate: PropTypes.func,
        translate: PropTypes.array.isRequired,
        url: PropTypes.string.isRequired
    },

    render: function() {
        var imgNodes;

            imgNodes = (
                <svg dangerouslySetInnerHTML={{__html: "<image xlink:href='" + this.props.url +
                 "' width='" + this.props.width +
                 "' height='" + this.props.height +
                 "'/>" }} />
            )

        return (
            <g
                className={["svg-img", this.props.className].join(" ")}
                transform={"translate(" + this.props.translate + ")"}
            >
                {imgNodes}
            </g>
        );
    }

});

module.exports = SvgImage;
Save.
Adding a subtitle
Adding a subtitle involves changing 10 different files. Instead of detailing all the changes here, I’ve pushed a commit to GitHub that has all the modifications in one place. That commit lives here.
Publishing your Chartbuilder to your own server
Once finished with all your customization, type npm run build into the command line. Chartbuilder will build your project and place your finished, customized Chartbuilder in the build folder. Next, move that onto your server. Ours is here!
Via GitHub: This is the easiest way to track changes you make.
Via FTP: Copy the contents of the build folder onto a new folder on your server with a program like Fetch or FileZilla.
- How to install and brand your own version of Chartbuilder - January 27, 2016
- Digital help filing your FOIA request - July 16, 2015


