How citizen journalists tap Silk, a new visualization platform to tell underreported stories
Want to triangulate that photo of Russian tanks barreling down the streets of Donetsk? Check out the citizen journalism being done at Bellingcat, a U.K. website focused on investigating and verifying underreported issues worldwide. Started by Eliot Higgins, a blogger, and funded in a Kickstarter campaign launched last summer, Bellingcat crowdsources and verifies photographs and reports on contentious and difficult to verify subjects like reported chemical warfare use in Syria, the British phone hacking scandal, and developments in the Russian invasion of Ukraine.
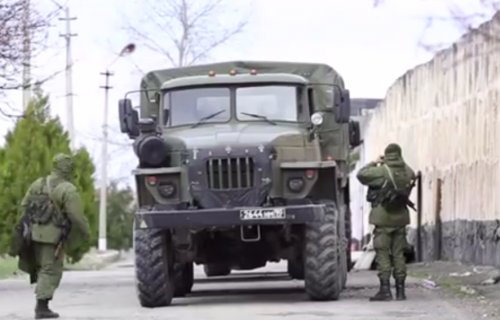
In late 2014, during the military escalation of the war in Ukraine, Bellingcat began publishing photos of tanks, heavy artillery, and soldiers posted on Twitter and other social media platforms. In February 2015, Higgins and his team of investigative citizen journalists started using the visualization platform Silk to show the wave of military equipment being rolled into Ukraine, ostensibly from Russia.
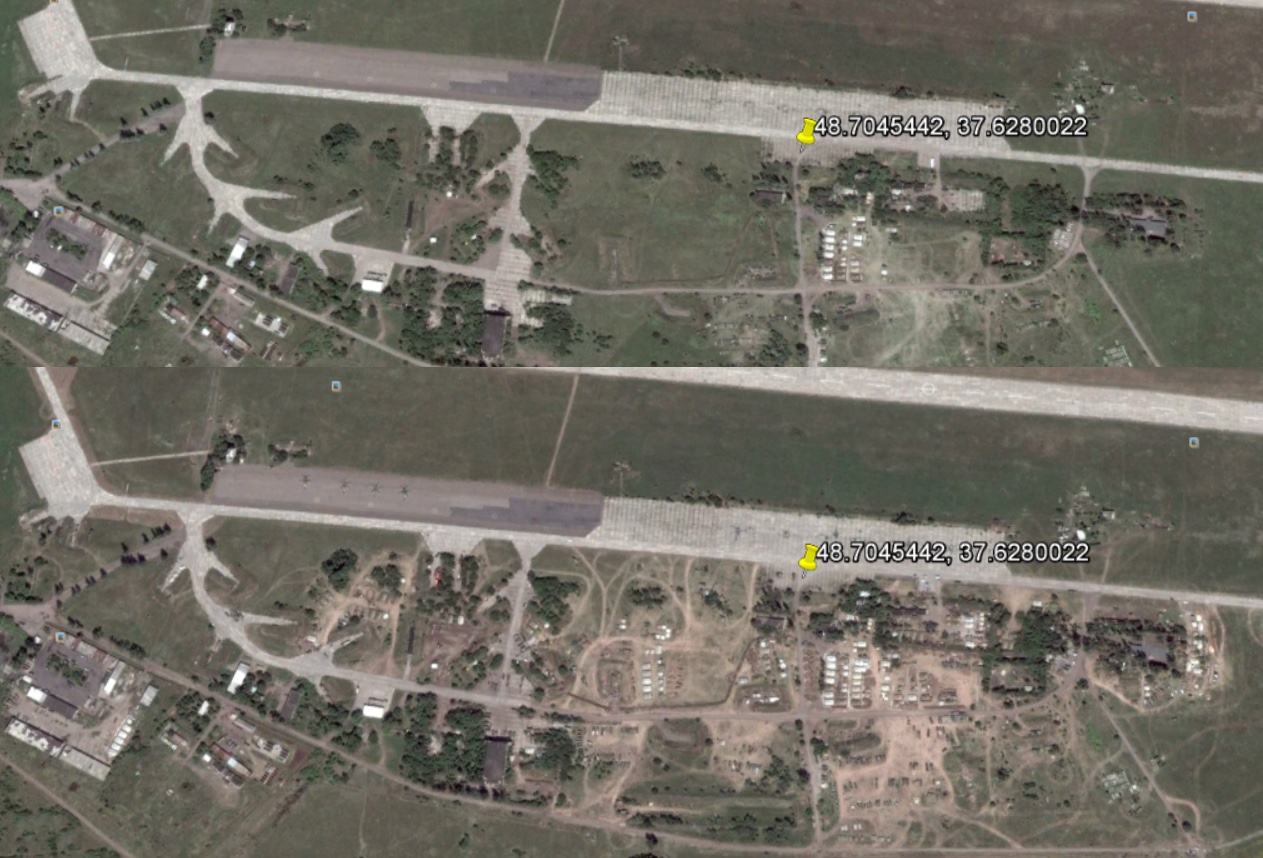
Bellingcat used Silk to illustrate the escalation by mapping out military sightings and providing additional data on the date of the sighting and the type of military equipment. They made their database public and asked the crowd to submit photos and information of their own sightings. (Data is verified by Bellingcat staff with the help of Checkdesk, a submission and verification engine.) The project was initially started on Bellingcat’s website until a representative from came along.
“I emailed Eliot and said ‘Can we help you guys?’,” says Alex Salkever, a former BusinessWeek technology writer and Silk’s head of product marketing. “I did a demo for them and they said ok. We helped them a little bit with structuring the data and now they have this very interesting record that is pretty good proof of Russian troops being in Ukraine.”

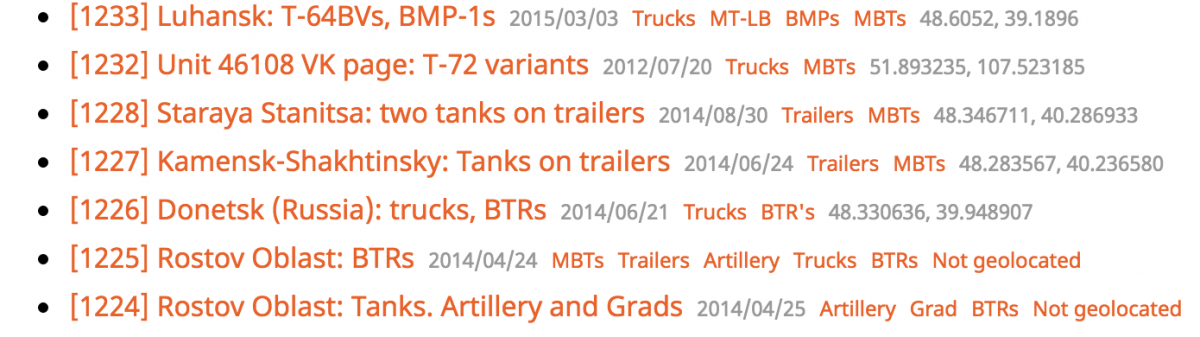
Once the data was inputted and geotagged, Silk made it easy to visualize the military equipment sightings. The database can be continually updated, too. One valuable feature of Silk’s is the ability to search through the publicly available dataset: a user can search through the dataset for a specific equipment category, for example. Want to see only tanks? Sure. Want to explore the data even more deeply? Click the Explore button for a table of the data.
Silk is free to use for journalists and Salkever’s on a mission to entice reporters and newsrooms to upload their data to Silk. He says it’s a useful platform for citizen journalism and small newsrooms trying to explore and visualize their data. “A lot of people are trying us out as a fast visualization and mapping tool,” he tells Storybench.
Silk isn’t the only data visualization platform out there. CartoDB is good for mapping geographic data and is slowly rolling out other visualization formats. Google Fusion Tables works fine for maps and simple graphs, but lacks customization features. Tableau Public has a steep learning curve, but can be used to create elegant interactive interfaces for large datasets. Silk is trying to incorporate features from each of those platforms and display them all on one dashboard. And it’s free, if you don’t mind your data being public.
For investigative citizen journalists like Higgins, that’s not a problem.