
How to clean data with OpenRefine
If you have ever been tripped up by mistyping or other errors in datasets, OpenRefine could be exactly what you need. As one of the better tools for exploring, cleaning and reshaping data, OpenRefine runs in a web browser, even if you’re offline. At the 2023 Investigative Reporters and Editors conference in Orlando, data specialist and IRE training director Cody Winchester introduced the program. Here’s how to get started.
Start the program and load some data
Once you’ve downloaded and installed OpenRefine, click the diamond icon to launch the program. On a Mac, the server starts up in the background; on a PC, a command prompt window will launch in the background — don’t close this window until you’re ready to quit! This what you should see when you open it:
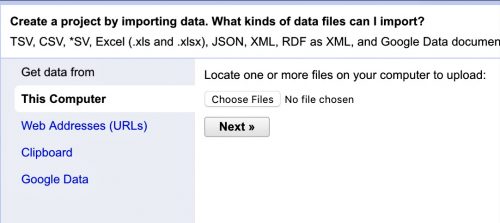
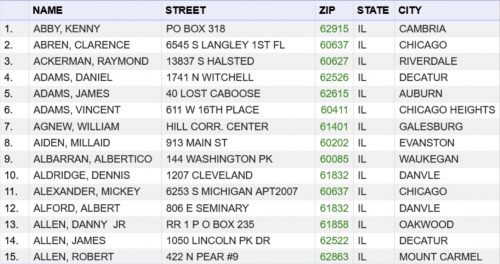
Now, we need some datasets to work with. First, we’ll be working with debtors.xlsx, a file of people who owed child support in Illinois. Make sure that “Create Project” is selected in the left-hand menu. Click the “Choose Files” button and find debtors.xlsx, then click “Next.” OpenRefine will show you a preview of the data in the top pane.
In the bottom pane, “Excel files” should be automatically selected in the “Parse data as” pane. (While you’re there, take a look at the other types of files that OpenRefine can work with). This file has a header row, so make sure that “Parse next 1 lines as column header” is marked.
If everything looks correct, click the “Create Project” button in the upper right-hand corner. Now, you’re in the project view.
Sorting data
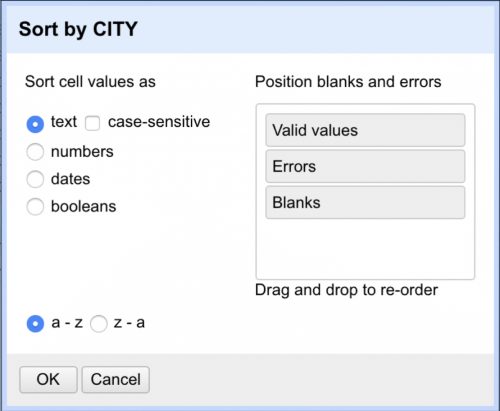
To sort the data, click the arrow next to the column you want to sort by. Let’s start with “CITY” and select “Sort” from the context menu. Then pick the options you want. Let’s sort by text, A-Z.
Undo or redo
If you accidentally clicked the wrong button, don’t worry — there’s an undo button! Click the undo/redo link in the upper left-hand corner to get a list of actions you’ve done so far, in order. Just click back up the list to rewind your work.
Filtering data
To filter your data, click on the triangle next to the column you’d like to filter on and select the “Text filter” option. A text box will pop up in the left-hand menu.
Let’s filter by the “CITY” column and keep only records with “chi” in the city name.
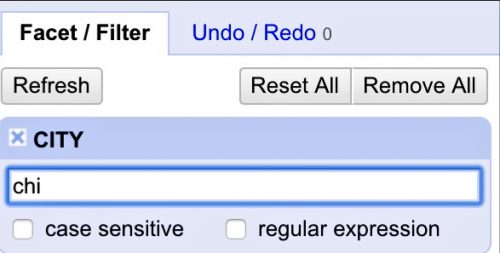
This should return 439 matches. You can have multiple filters. Each one will show up in this pane on the left-hand side of the screen. To clear a filter, just click the X icon in the upper left-hand corner of the filter box.
Basic data cleaning
As you would do in any data program, you’ll want to make a copy of the original column and work on that instead of the original data. We’ll start with the “CITY” column. To duplicate a column, click on the arrow next to the column name and select “Edit column” → “Add column based on this column.”
In the window that pops up, call the new column “CITY_CLEAN.” In the Expression text box, you can leave it as a value — this just means that you will take whatever value is in the column and copy it over.
Now we can go to work on our new column. Let’s start by trimming excess whitespace, similar to the =TRIM() function in Excel. Click on the dropdown arrow next to our new “CITY_CLEAN” column and navigate to “Edit Cells” → “Common transforms” → “Trim leading and trailing whitespace.”
OpenRefine will report the results of this operation in a yellow alert box toward the top of your screen. In this case, nothing happened because we didn’t have any extraneous whitespace.
Now, let’s do another common cleaning task: splitting a column with names in “LAST, REST” format into two new columns.
First, following the steps we did above, copy the values in the “NAME” column over to a new column called “NAME_SPLIT.”
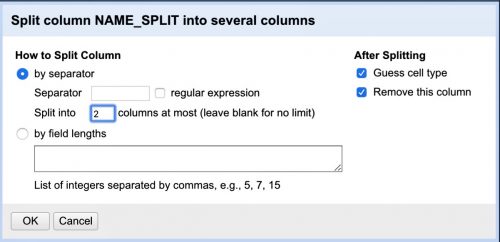
Now, we want to split this into two columns based on a separator. Lucky for us, OpenRefine has this functionality built in. Click on the dropdown arrow next to the “NAME_SPLIT” column and select “Edit Column” → “Split into several columns.”
We want to split columns on a separator — a space — and we want to split into two columns at most.
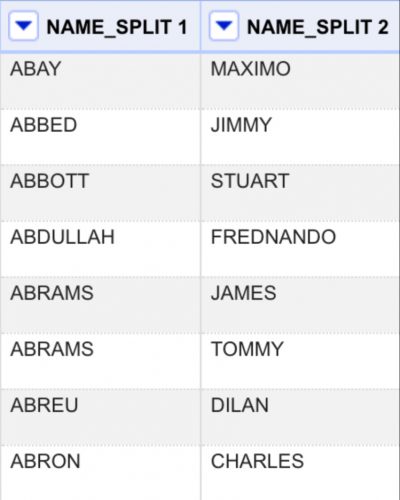
That way, if there are any “SMITH, JOHN JAMES JR.”names, “JOHN JAMES JR.”will end up in one “NAME_SPLIT 2” column, rather than getting spread across three columns. Here’s what you end up with:
To rename a column, click on the dropdown arrow next to the column name and navigate to “Edit column” → “Rename column.”
Facets and clustering
Facets are a powerful way to group data and reconcile duplicate or fix garbage values. Let’s start by taking a look at the “CITY_CLEAN” column. Click on the arrow dropdown next to the “CITY_CLEAN” column and select “Facet” → “Text facet.”
A box will pop up in the left-hand pane with a list of unique values in that column — this is like running a pivot table in Excel and counting the values in each group.
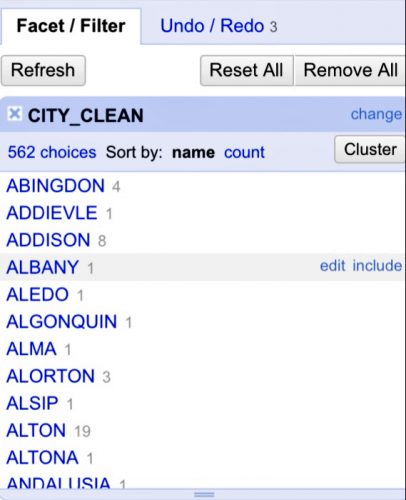
You can sort the results A-Z by text or Z-A by count. As you scroll through the list, you’ll notice that “CHICAGO” is represented in several ways, as is typical for hand-entered data.
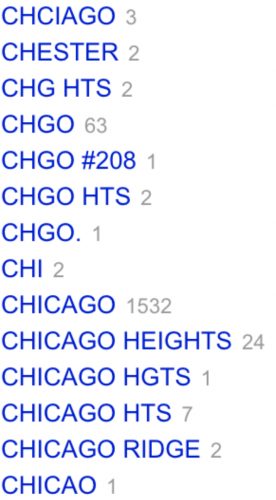
You could edit each record manually, but there is a better way to do it. Click the “Cluster” button in the upper right-hand corner of the facet box. The window that pops up will show you records that the program has determined might refer to the same thing — for instance, one row with “CHGO.”and 63 rows with “CHGO,” no period. Or “MT VERNON”and “MT. VERNON.”
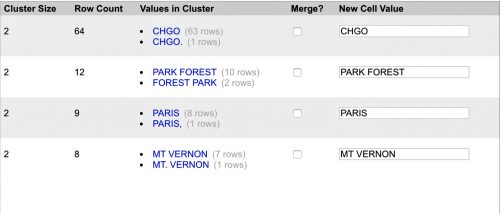
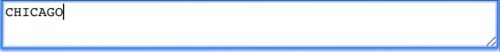
In the text box to the right, you can select the canonical version of the city name and check the “Merge” box next to the ones you want to merge. (“PARK FOREST” and “FOREST PARK” are two different cities, so we do not want to merge them.)
Click the “Merge selected and Re-cluster” button at the bottom of the window. Sometimes the algorithm will turn up more possible matches, and you deal with the next round. In this case it didn’t, but there are other keying functions to try in the dropdown menu to the right.

Each of these key functions applies a different algorithm that surfaces possible matches.
If you’re not sure whether every record in a cluster is actually the same thing, you can hover over the “Values in cluster” table cell and click “Browse this cluster.”
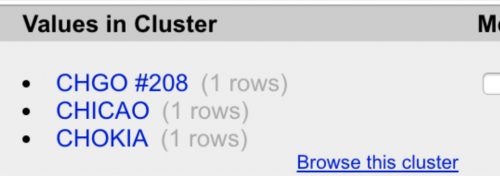
That will open a new tab with just those records as the results, and you can do whatever reporting is necessary to determine whether they belong together or not.
Once you’re done clustering, you can scroll through the list in the left-hand side pane and fix any stragglers — hover over the name and click “Edit” to manually change them.
If you’ve got time or date data, you can also run timeline facets.
Say you wanted to look at the distribution of dates of birth of people with child support orders. You could click the dropdown next to the “DOB” column and select “Facet” → “Timeline facet.” This will pull up a timeline chart in the left-side pane:

You can use the handles to scrub back and forth to filter your data by date. It’d be a good idea to check just the “Blank,” “Non-Time” and “Error” boxes to interrogate records with missing values.
Adding calculated columns
Remember when we used the expressions editor to create a new “clean” column to work on as we cleaned data? You can also use the Expressions editor for more complicated calculations.
In this case, we want to create two new columns: one with the debtor’s age at the time the child support order was entered, and one with the debt per child for each order.
In this page, you will learn how to get the difference between two dates in OpenRefine.
For our purposes, we want to calculate the difference, in years, between the “DOB” value and the “ORDER_DAT” value. We’ll start by clicking the dropdown next to the “DOB” column and selecting “Edit column” → “Add column based on this column.”
Call the new column “AGE_AT_ORDER.” Then, in the expressions editor, we can write: “diff(cells[“ORD_DAT”].value, cells[“DOB”].value, “years”)”
Check the preview to make sure the results seem reasonable and click “OK.” (If you get a negative number, you probably need to switch the order of the columns. You want to put the name of the column that has the most recent date first.)
Extract/apply
Clicking the “Extract” button will display each of the cleaning steps you’ve performed so far as JSON data. If you’re working with data that is updated regularly, or you’re working with several datasets with the same structure requiring the same cleaning steps, you could save these instructions in a file on your computer — you can just paste into a plain text file with a .json extension — and then, for each subsequent dataset in the series, instead of manually walking through each cleaning step after you load it into OpenRefine, you can instead click the “Apply” button, paste in the cleaning instructions and then apply them to your new data.
Exporting your results
Your project is saved automatically and incrementally, and it will pop up in the list of projects each time you start up OpenRefine.
To export your clean data from OpenRefine, click the “Export” button in the top right-hand corner of the browser and select the format of your choice.
Quitting OpenRefineClick out of the browser tab. On a PC, close out of the terminal window that’s been running in the background. On a Mac, flip over to the OpenRefine program and click “Command+Q” to quit.

- How to clean data with OpenRefine - September 8, 2023


