Should newspapers be adding confidence intervals to their graphics?
Why do we have such a hard time visualizing uncertainty? Amanda Cox, editor of The Upshot at The New York Times, touched on that theme in her keynote presentation at the OpenVis conference in Boston last month. Why, she asked, are newspapers like hers hesitant to print confidence intervals, a statistical measure of uncertainty? With the exception of noting sampling error in polling data, newspapers like the Times only show uncertainty when they’re forced to – and often to prove the opposite of what point data might show.
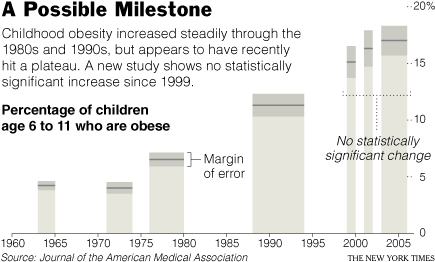
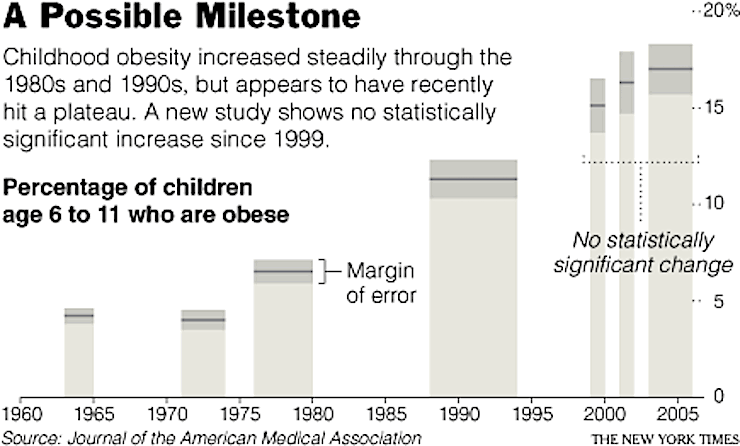
In digging through the paper’s print graphics archives, Cox said she could find only eight instances in which the Times had “formally expressed some type of confidence interval,” she said. “Most of them is when we felt like we had to.” One example is a 2008 graphic showing childhood obesity rates. If point data had been plotted, Cox explained, it would have looked like childhood obesity rates were rising in the mid-2000s. But with confidence intervals shown – and by citing a study from the Journal of the American Medical Association – the Times could argue that childhood obesity rates were not rising.
But confidence intervals shouldn’t just be shown to prove a point, said Cox. “I’m kind of convinced that that’s our norm, that we only do it when we’re forced.”

Hey, but I use error bars all the time!
While data visualizers focus on sampling error a lot, Cox argued, it’s not enough. “We focus all the time on sampling error, we put it in our footnotes and we think it’s enough. And it turns out it’s not really enough.”
Cox offers a solution. Newspaper graphics teams – and data visualizers on the whole – should get more comfortable with uncertainty.
“I do think that if we got more comfortable with uncertainty, if we got more comfortable with the fact that we don’t know the future but that we can have educated guesses about things, I think that there are real world implications and policy consequences to that.”
Getting more comfortable w/ uncertainty has real world policy impacts & is something worth fighting for. Thank you @amandacox #openvisconf
— OpenVis Conf (@OpenVisConf) April 25, 2017
Further reading on confidence intervals
“Margin of Ignorance,” Columbia Journalism Review
“Data journalism lesson with crime stats: Parsing close-call numbers,” Journalist’s Resource
“News and Numbers,” Victor Cohn, Lewis Cope


