Of Data, Theater and Healing: The Art of Federica Fragapane
Editor’s note: This is the first of two stories featuring information designer Federica Fragapane. This article focuses on the importance of information design, her attention to detail, collaboration and her relationship with theatrical work that influenced her visualizations.
For Federica Fragapane, an independent information designer with a love for theater, combining elements from the two forms of storytelling helps her connect with audiences on an emotional level.
Fragapane is a multifaceted freelance information designer based in Italy, focusing on transforming cultural, environmental and social data into enchanting visualizations. She thinks of “visualization as a visual megaphone” that creates an emotional bond with the readers, which she attributes to her experience in theater.
“In general, acting in a play means always keeping the audience in mind and always trying to create a connection with the audience,” said Fragapane. “In designing visualizations, you cannot check how the readers are but it’s always important to take them into consideration in all the steps of the design process.”
Fragapane has designed pieces for the United Nations, Scientific American, Corriere della Sera — La Lettura, Google, and BBC Science Focus Magazine, to name a few. In 2018, she illustrated a children’s book, “Planet Earth: Infographics for Discovering Our World.” The book uses infographics, eye-catching illustrations, and scientific data as major guidelines to travel across the world and discover earth’s secrets.
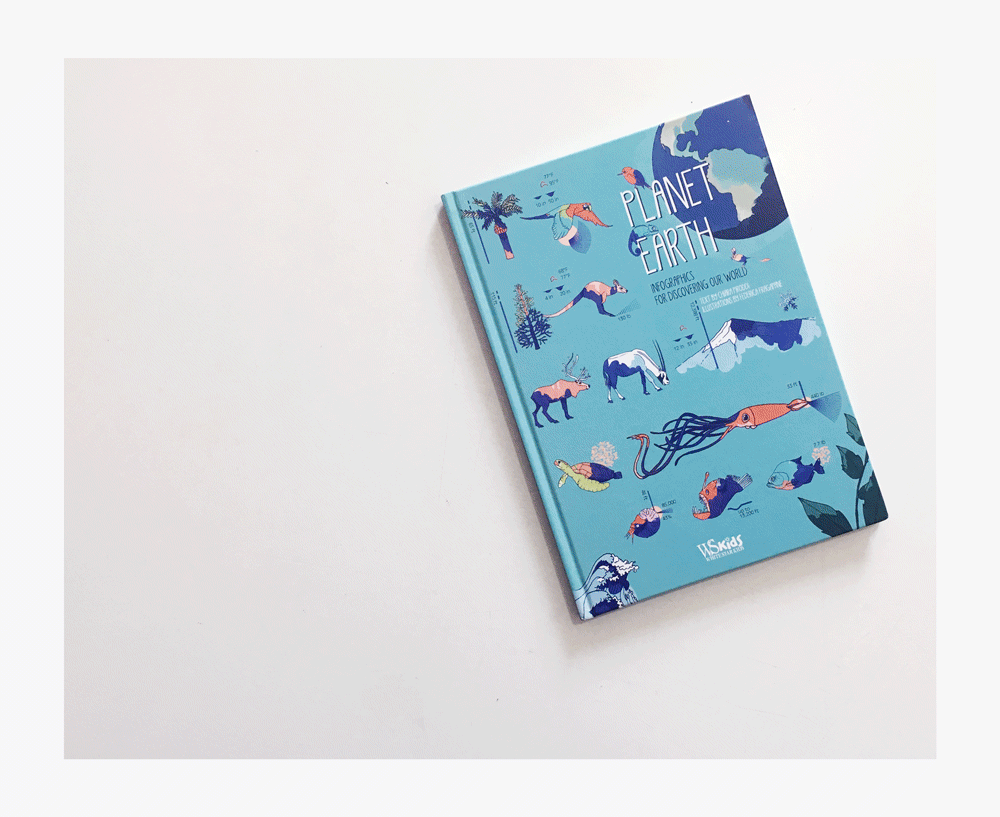
Planet Earth by Federica Fragapane. Source
Storybench spoke to Fragapane about the importance of information design, collaboration, attention to detail and her relationship with theatrical work in crafting museum-worthy visualizations.
The following conversation has been edited for brevity and clarity.
Tell us about the importance of information design today
I’ve always been passionate about using numbers and data to talk about topics or issues that are relevant. You cannot always choose the topics to deal with, of course. But, I have been lucky enough to meet different clients. I could propose the topics to [my clients] and that allowed me to declare to the outside world [that] these are the topics I’d like to work on, these are the subjects I’m interested in. I think it’s essential.
People are often scared of numbers, tables and complex graphics. I try to work on engaging people. For me, it’s a communication flow. The first step is inviting people to read my pieces and go through my visualizations. I think the role of infographics in communicating issues and creating awareness is very important.
Is there a role for infographics in video storytelling?
It would be better to have simpler infographics. If you use a defined set of frames for one information and then after a few seconds you show another one, they need to be easy enough that people can remember and connect with the following one. I’ve never worked on animated infographics. I added animations to my infographics but it’s something different. I’ve never worked on video with infographics. I think that it can be super helpful, but it has to be balanced very well.
Your style is positive and engaging. How did you develop your style?
It was pretty instinctual and a natural process for me. I have started to learn what I like and what my eyes are attracted to. Looking for inspiration on Pinterest is a very basic answer, but it’s what I do, or going to museums, [see] illustrated books, or artworks. I want to do something that if it wouldn’t have been done by me, I would have said, ‘Oh, I really would have done it.’ I would like to be jealous of my own work. That was my starting point when I started working as a freelancer.
I love to see what my colleagues are doing, or in the newsrooms. I like to take inspiration from works that are not related to data visualization. These help me a lot in understanding the shapes and the colors I’m personally attracted to. They also change over time. I had a very blue and red moment. Now, I’m more into pink. It doesn’t depend on the current design trends, but it’s what I personally like.
Could you tell us about the collaborative workflow with your team? At what point do you decide that the illustration is ready to be made interactive?
This really depends on the output. I work on static visualizations independently using Adobe Illustrator, and send the files directly to clients.
For the interactive projects, it is not really my team, we are three independent professionals. Alex Piacentini is a UX designer and Paolo Corti is a developer specialized in data visualization.
There are interactive projects in which I already know that I will need their support and their competencies. Sometimes all three of us work together, sometimes I just work with one of them. If I have an idea, I send it to them to understand the feasibility. There are cases in which we found an idea that is [promising]. I sketched a few drafts with Illustrator and Figma. They developed it with the D3.js. Sometimes [when] we want custom solutions, I directly draw the pieces on Adobe Illustrator and send them the SVG files, they use them to build the visualizations. It really depends on the needs. We check the interactions together, the possible ways in which the users can interact with a piece .
Did you feel the need to learn coding for your work at any point?
I started working in this field in 2012 and started freelancing in 2015. During that time, I said, ‘Okay, I will have some free time. Let’s start studying.’
I actually didn’t, because I started working a lot, luckily enough. I understood that I really needed something at a super high level. I know I won’t be able to reach that level because they are the people I collaborate with for their superior skills. I understand the value of collaboration, because it’s super important. I prefer to have my competencies. I’m still studying to improve my work. At that moment, I understood that it’s better to work with people. In general, it’s very nice to collaborate with external points of view, as they are super helpful. But for people who want to learn coding, I would definitely recommend it.
You have spoken about being a visual designer whose “eyesight is not perfect” anymore and have mentioned that the healing process was important for your design approach. Tell us about the relationship between your healing and approaching to design
It was in 2012, I almost lost the sight in my left eye. During the healing process, I was looking for small improvements everyday. I used to stand in front of an illustrated magazine, covering my healthy eye and trying to look for the details that day by day emerged from the pages. At first, everything was white. As the days were passing by, I started to see some new shapes and details emerging. Of course, it was a very intense healing process of starting to see things again. That process had an impact on my approach to visuals.
I learned again our love for seeing things and details emerging. Now, my deep care on details can be related to that particular moment.
What is the relationship between theater and creating visualizations?
I’m passionate about theater. I brought plays on stage as an actress and director. It was an experience I still love. I tried to mix my passion with my job because I was curious to see what would have happened.
Everything is a result of a choice. If I’m visualizing data in a certain way, it is because I’m creating a specific layout because of a set of choices that I made. When I directed some plays, if I were in a position and the other actresses were in other positions, that was because of choices.
In general, acting in a play means always keeping the audience in mind and always trying to create a connection with the audience. It’s very important to feel the audience, to feel how they are behaving, how they’re receiving you.
In designing visualizations, you cannot check how the readers are. But it’s always important to take them into consideration in all steps of the design process.
- How investigative journalists followed the money in the Pandora Papers - March 4, 2022
- Federica Fragapane on Using Minimalistic Shapes, Lines and Tree Branches to Convey Powerful Stories - February 28, 2022
- Of Data, Theater and Healing: The Art of Federica Fragapane - February 21, 2022


