How to explore and manipulate a dataset from the fivethirtyeight package in R
The fivethirtyeight R package – released by Albert Y. Kim, Chester Ismay, and Jennifer Chunn last March – contains dozens of datasets used in FiveThirtyEight news articles like “A Handful Of Cities Are Driving 2016’s Rise In Murders,” “The Best MLB All-Star Teams Ever,” and “The Dallas Shooting Was Among The Deadliest For Police In U.S. History.” This tutorial will explore the murder_2015_final dataset using tidyr principles like tibble, gather, arrange and separate from our tidyverse tutorial.
Install and load the package
Using RStudio, we’ll install and then load the fivethirtyeight package, as well as tidyr, tibble and dplyr and then call murder_2015_final.
library(fivethirtyeight)

library(tidyr)

library(tibble)

library(dplyr)

murder_2015_final
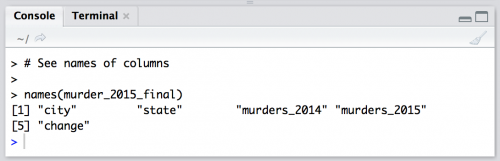
Look at the dataset’s column names
Use names(murder_2015_final) to list out the dataset’s column names.
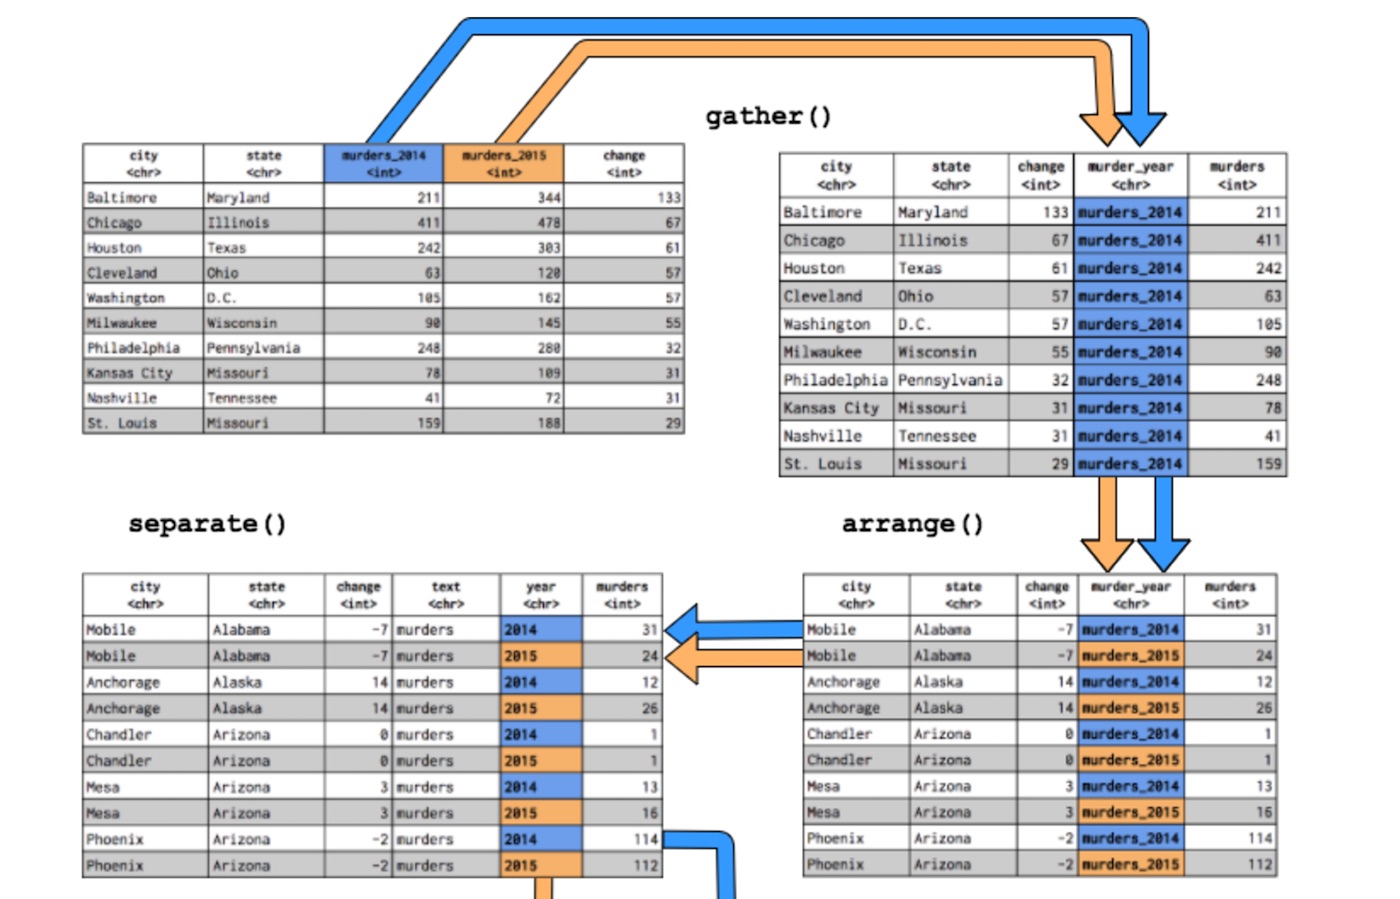
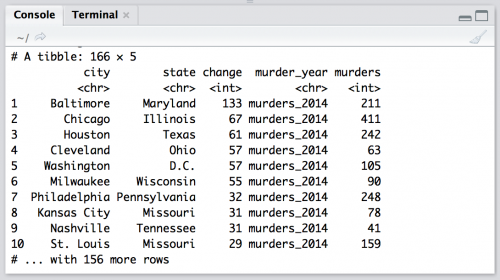
Gather variables into a single column
Lets gather up the two year variables, murders_2014 and murders_2015 into a single year column we’ll name murder_year. We’ll store the number of murders in a column titled murders and call this new object murders_gathered.
murders_gathered <- murder_2015_final %>%
    gather(
        murder_year,
        murders,
        murders_2014:murders_2015,
        na.rm = TRUE)
murders_gathered
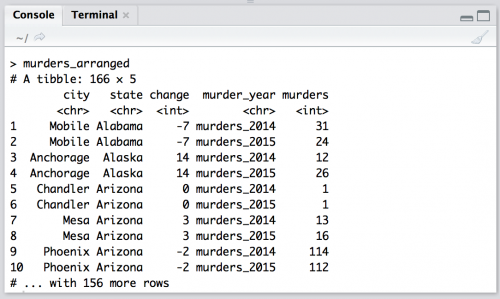
Arrange data alphabetically by state and city
Now let’s arrange this data alphabetically by state and city. We can do this with arrange() from the dplyr package. (We’ll learn more about dplyr in the next tutorial!)
murders_arranged <- murders_gathered %>%
    arrange(
        state,
        city)
murders_arranged
So now we have the two years in a single column (murder_year), but the repeating murder_ text is redundant. I want to get the year in a column by itself.
Separate “murder_year” column into “text” and “year”
Now I want to put the murder years (2014 & 2015) back into two different columns. I’ll do this with separate().
The separate() command uses a name of the existting column we want to separate (murder_year), and the names of the columns that will contain the separated values (c("text", "year")).
murders_separate <- murders_arranged %>%
    separate(
        murder_year,
            into = c("text",
                     "year")
        )
murders_separate
Great. Now I can use spread() to put the year back into two different columns, 2014 & 2015. But I will combine this with arrange() so the output is easier to read.
murders_spread <- murders_separate %>%
    spread(
        year,
        murders
        ) %>%
        arrange(
            state,
            city)
murders_spread
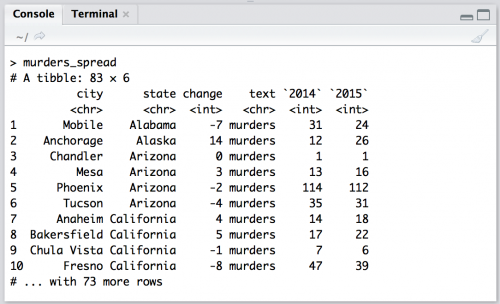
What if I want to combine city and state into a single column city_state?
Using unite to paste one column into another
The final command, unite(), lets me paste the contents of columns onto one another. It requires the name of the new column city_state and the columns I want to combine city and state. But I want to sort this new tibble in descending order of change, and I want to remove the text variable.
I can combine all of these together with the pipe (%>%).
murders_final <- murders_spread %>%
unite(
city_state,
city,
state) %>%
arrange(
city_state
) %>%
select(
-(text)
)
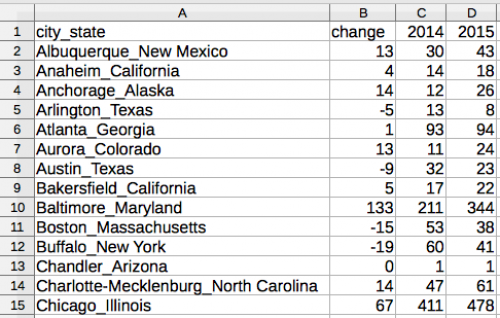
murders_final
Output the new table as a csv
Use write.csv(murders_final, file = "murders_final.csv",row.names=FALSE, na="") and voilá, you have a csv.
Full script
A recap of what we learned
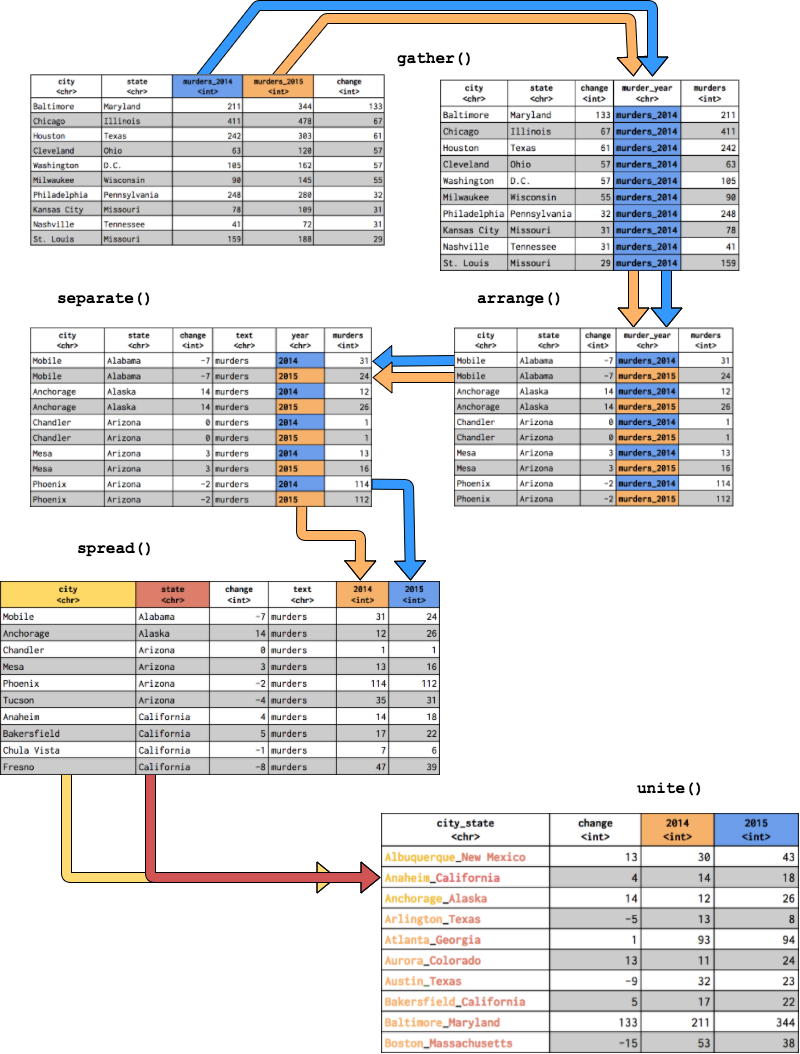
We used the pipe operator to string together various tidyr and dplyr functions for structuring our data (in tibbles). Remember that:
gather()collects data across columns and puts it into into rowsarrange()sorts the data in each columnseparate()divides the contents of a column apart into new columnsspread()distributes data from rows into columnsunite()attaches the contents from one column onto the contents of another column
A quick barplot
By typing barplot(murders_final$change), you can create a quick barplot of the change in murders by city.
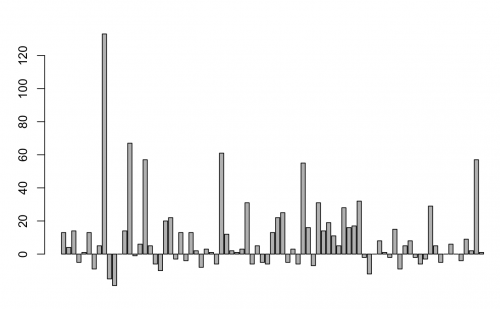
Obviously, the barplot is not visualizing the “change” column sorted low to high. To do that, try your hand with arrange().
murders_final_sort %
  arrange(
    change)
murders_final_sort
Then, plotting barplot(murders_final_sort$change) will produce this:
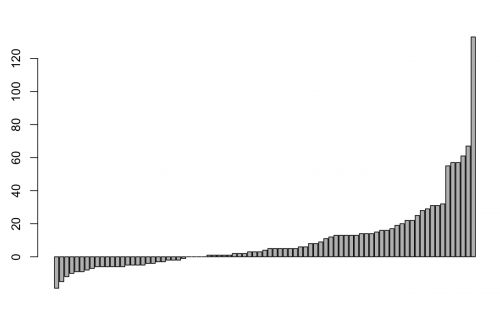
To extend the y-axis to -20, add:
barplot(murders_final_sort$change,
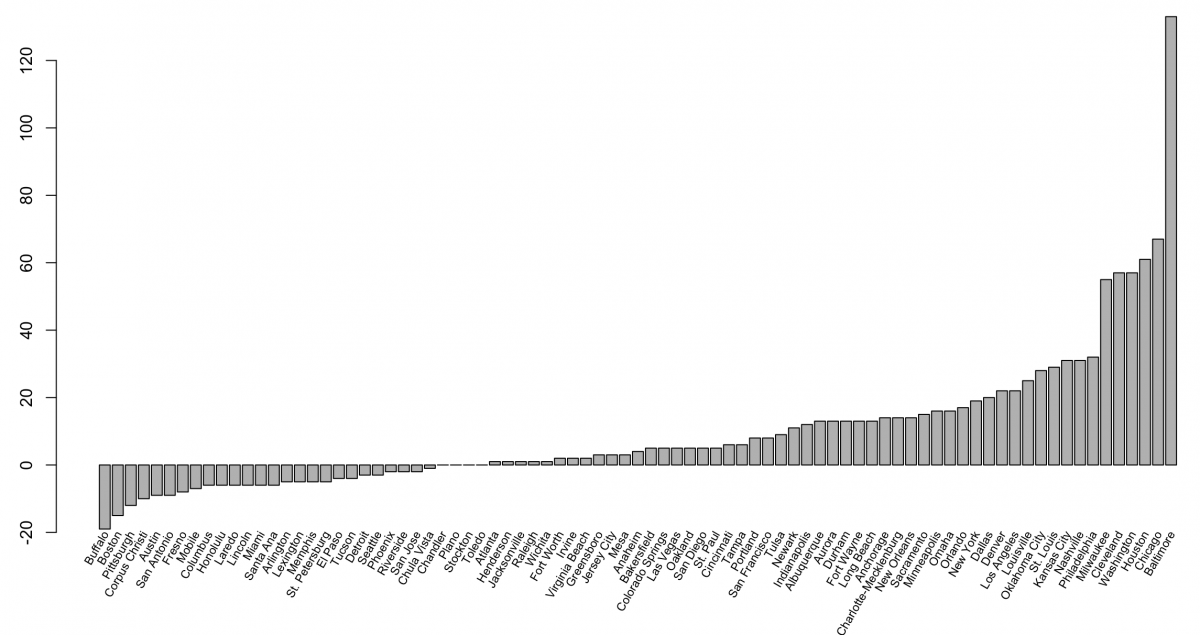
ylim = c(-20, 120))Finally, we’ll add some labels. There are many different ways to add labels in R. Here’s one way:
midpts <- barplot(murders_final_sort$change,
                  cex.axis = 1.0, cex.names = 0.6,
                  ylim = c(-20, 120), main = "Change in murders from 2014 to 2015"
)

text(murders_final_sort$city,
     x = midpts,
     offset = -0.1,
     y = -20,
     cex = 0.5,
     srt = 60,
     xpd = TRUE,
     pos = 2
) 
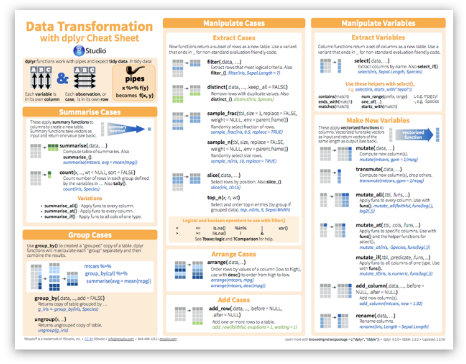
Pro tip: RStudio publishes super helpful cheatsheets. Here’s one for dplyr:
- Getting started with stringr for textual analysis in R - February 8, 2024
- How to calculate a rolling average in R - June 22, 2020
- Update: How to geocode a CSV of addresses in R - June 13, 2020


Excellent example and really instructive flow chart explaining each transformation, thanks Martin. A couple of small comments:
1. I believe that you may have lost a small part of your code and that:
murders_final_sort %
arrange(
change)
murders_final_sort
should be:
murders_final_sort %
arrange(
change)
murders_final_sort
2. Also murders_final_sort contains city_state rather than city, so to reproduce the final barplot labels as you have shown them in your plot, we would need an extra separate step like this:
murders_final_sort %
separate(
city_state,
into = c(“city”,
“state”),
sep= “_”
)
(It is obviously necessary to specify the separator explicitly here, since otherwise data is lost whenever the city or state names comprise more than one word.)
Thank you for the feedback, Andrew!
RE: 1st. Comment
I think you meant the code chunk:
“`r
murders_final_sort %>%
arrange(
change)
murders_final_sort
“`
does not work because the `murders_final_sort` has not been created yet. You should see this error:
“`r
# Error in eval(lhs, parent, parent) : object ‘murders_final_sort’ not found
“`
The correct code chunk is:
“`{r murders_final_sort}
murders_final_sort %
arrange(
change)
murders_final_sort %>% glimpse()
“`
RE: 2nd comment: Also `murders_final_sort` contains `city_state` rather than `city`, so to reproduce the final barplot labels as you have shown them in your plot, we would need an extra separate step
This is true and your solution will fix the labels. But I would probably prefer the ‘fewer keystrokes and neurons’ option of using the `city` column from `murders_gathered`. Even though `murders_gathered` has 166 observations (and `murders_final_sort` has only 83), we can use the 83 unique cities from this data frame as the labels.
“`{r check_length}
murders_final_sort %>% nrow()
murders_gathered$city %>% unique() %>% length()
“`
The `murders_final` and `murders_final_sort` were created to show the final tables in the figure above for `spread()` and `unite()` (that’s why `city_state` was created in two different colors).
Thank you for taking the time to check this and provide feedback! I’ve created a Github repo (https://mjfrigaard.github.io/StoryBench_tidyr_how2/) for a new script and will update the post to reflect these changes.
– Martin
Yes, sorry Martin — I somehow messed up with my copy and paste on my first comment. As you surmised, I meant to suggest using
murders_final_sort %
arrange(
change)
murders_final_sort
(or equivalent) instead of your original version.
Best regards,
Andrew